


Bitcoin markets present a structural asymmetry: while on-chain data shows large wallets accumulating aggressively and spot ETF inflows hitting year highs, price action remains trapped in a consolidation zone that masks genuine uncertainty about institutional follow-through. This tension between accumulation signals and price hesitation hinges on whether the institutional cohort maintains conviction through technical tests or begins trimming exposure into strength. The next 48 to 72 hours will clarify whether these patterns reflect sustained capital conviction or tactical positioning ahead of a larger correction.
Top Regulated Brokers
Why Bitcoin Accumulation Matters Now
Bitcoin whale wallets (addresses holding 1,000+ BTC) have added over 122,000 BTC in the past four weeks, according to CryptoQuant, a level that mirrors accumulation behavior observed in March 2024 before a 22% rally.
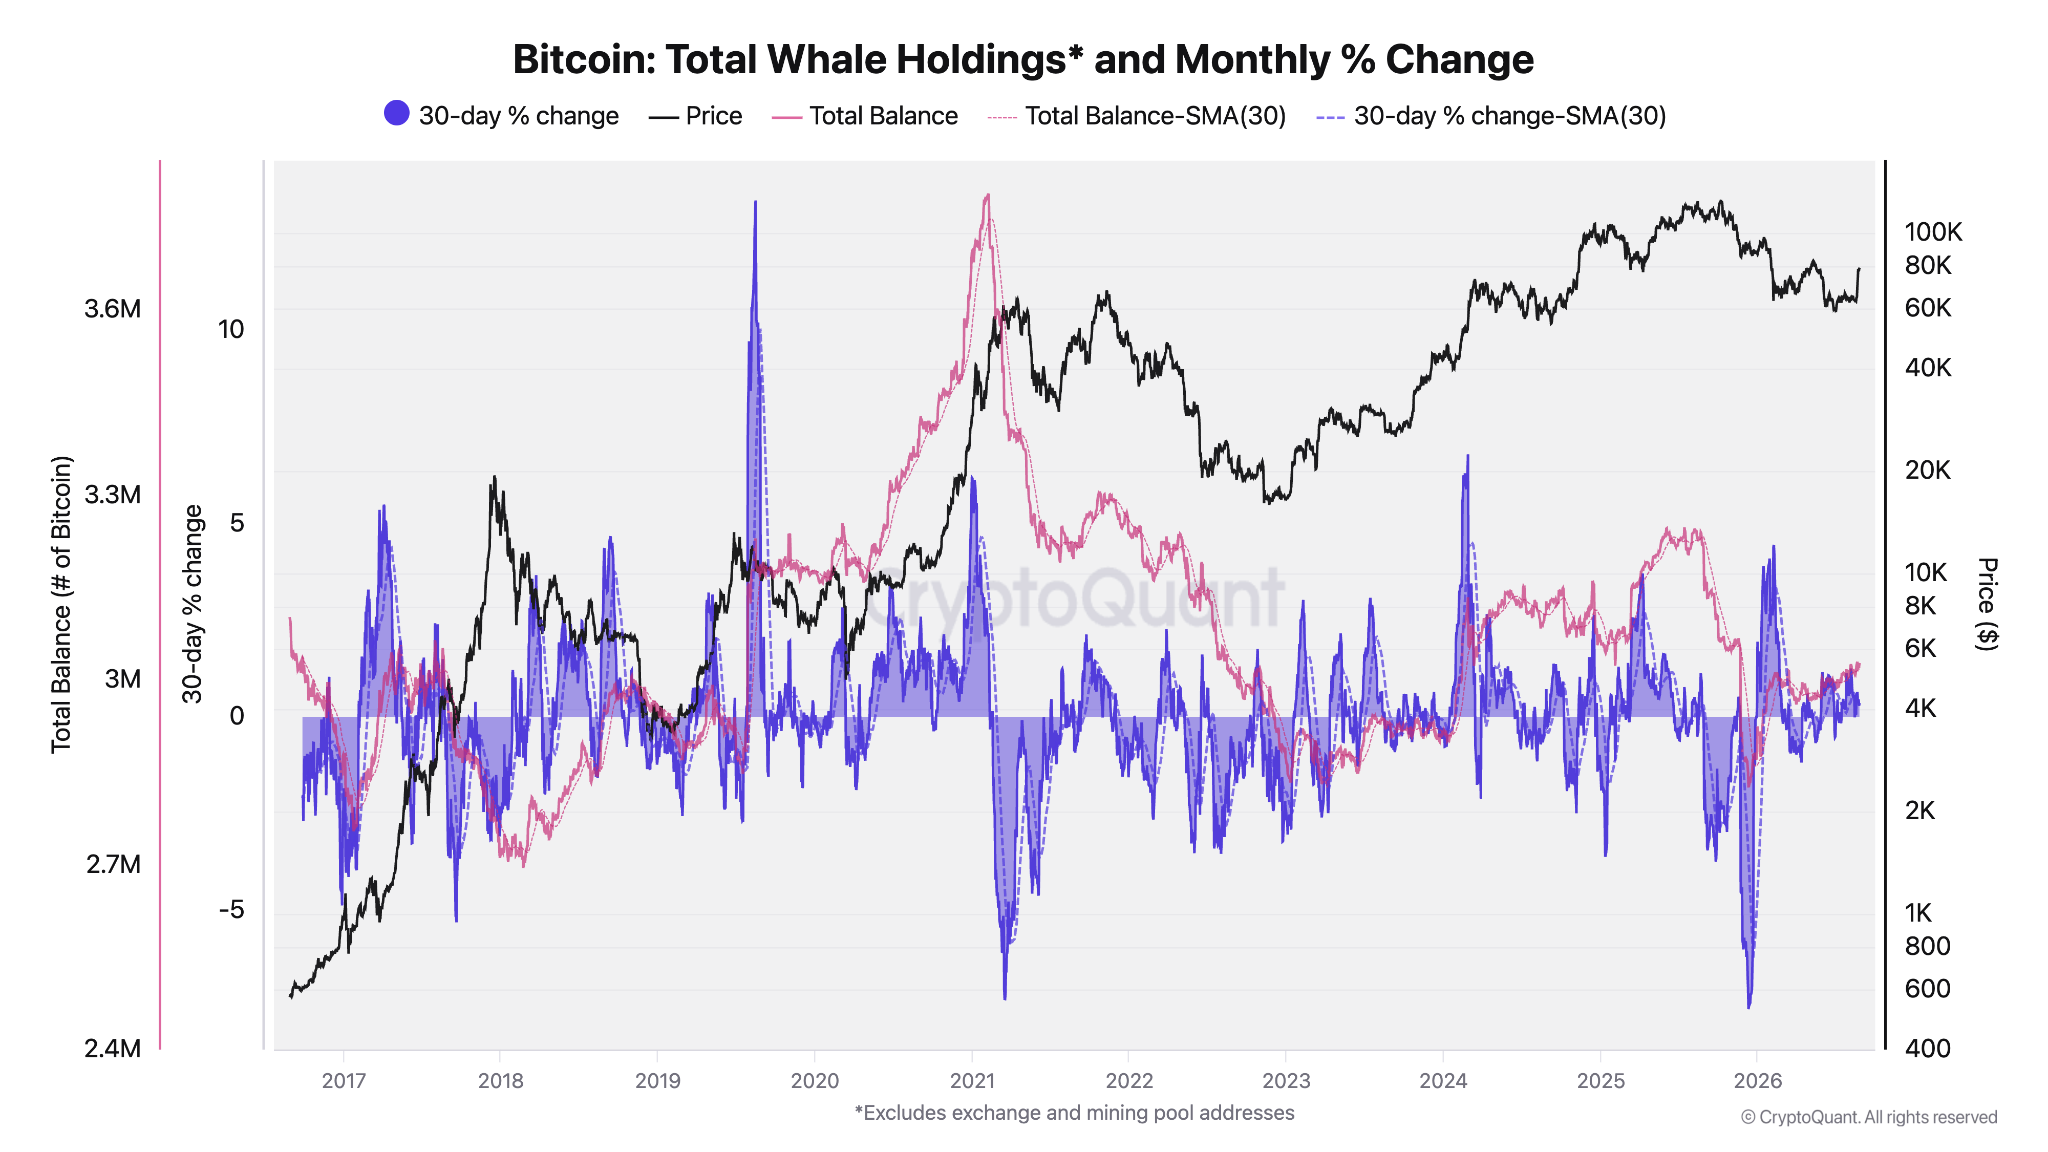
Bitcoin: Total whale holdings and monthly change (%). Source: CryptoQuant
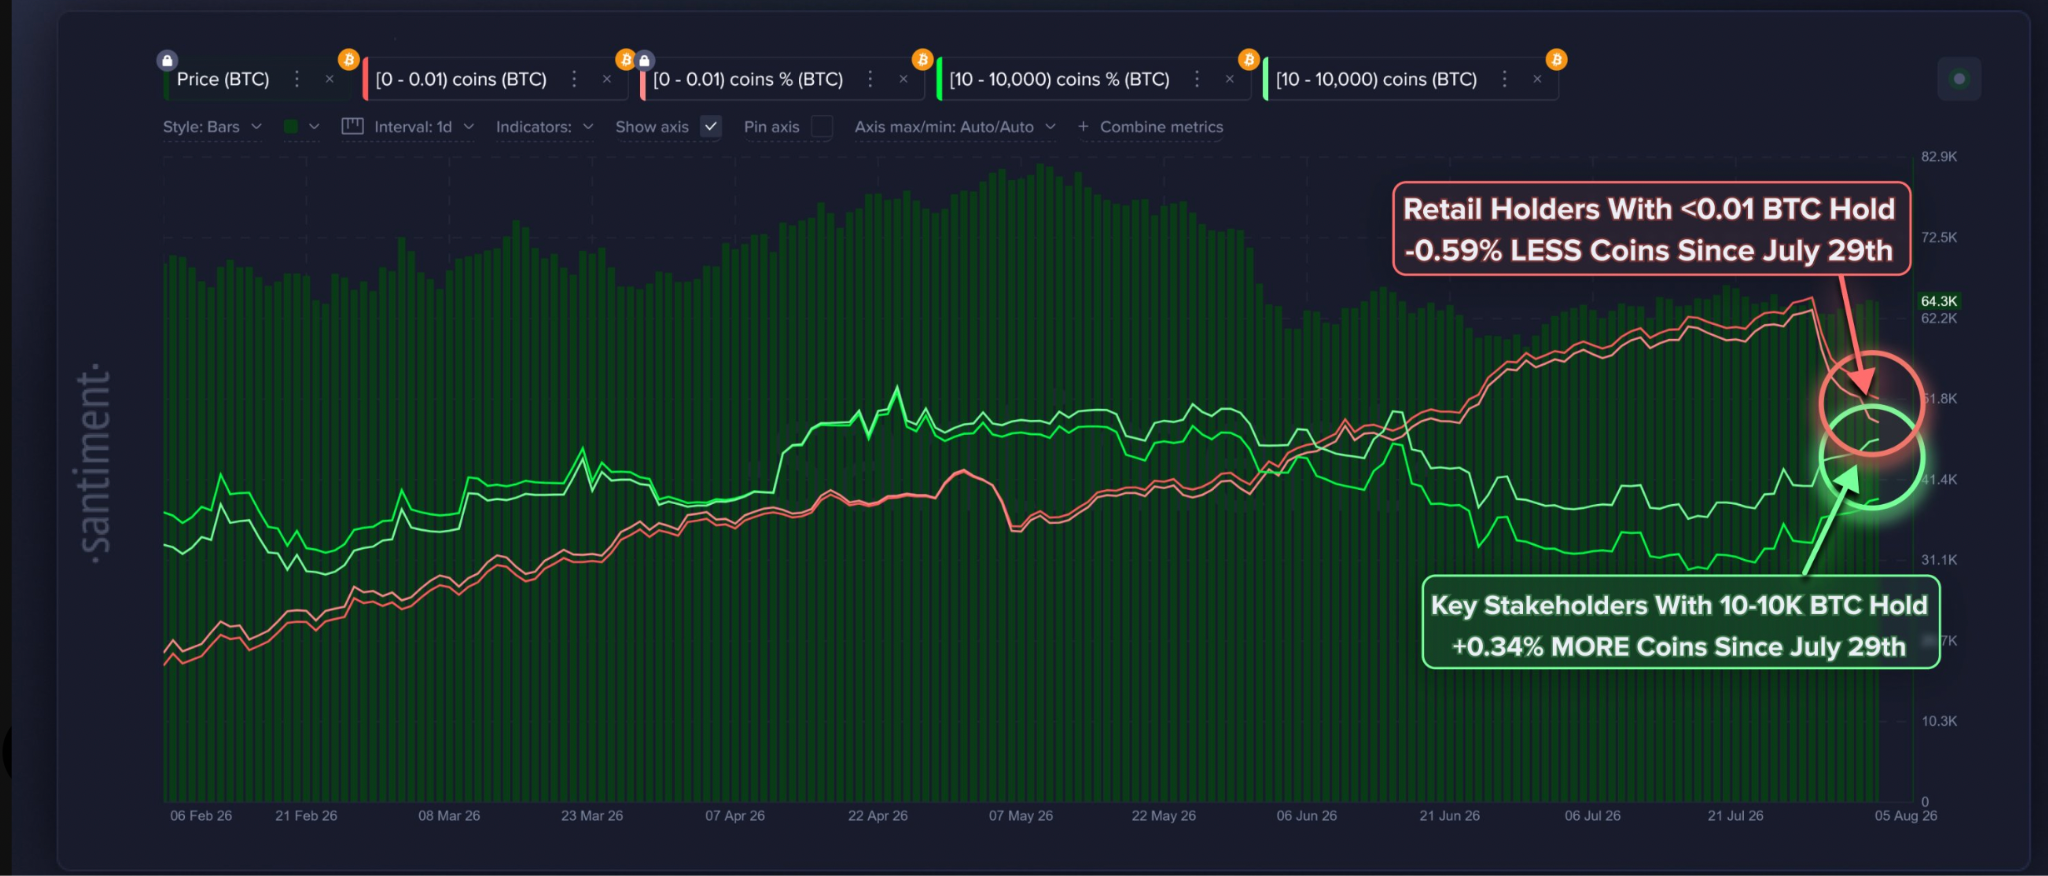
Number of coins held and number of wallets 100-1K BTC addresses. Source: Santiment
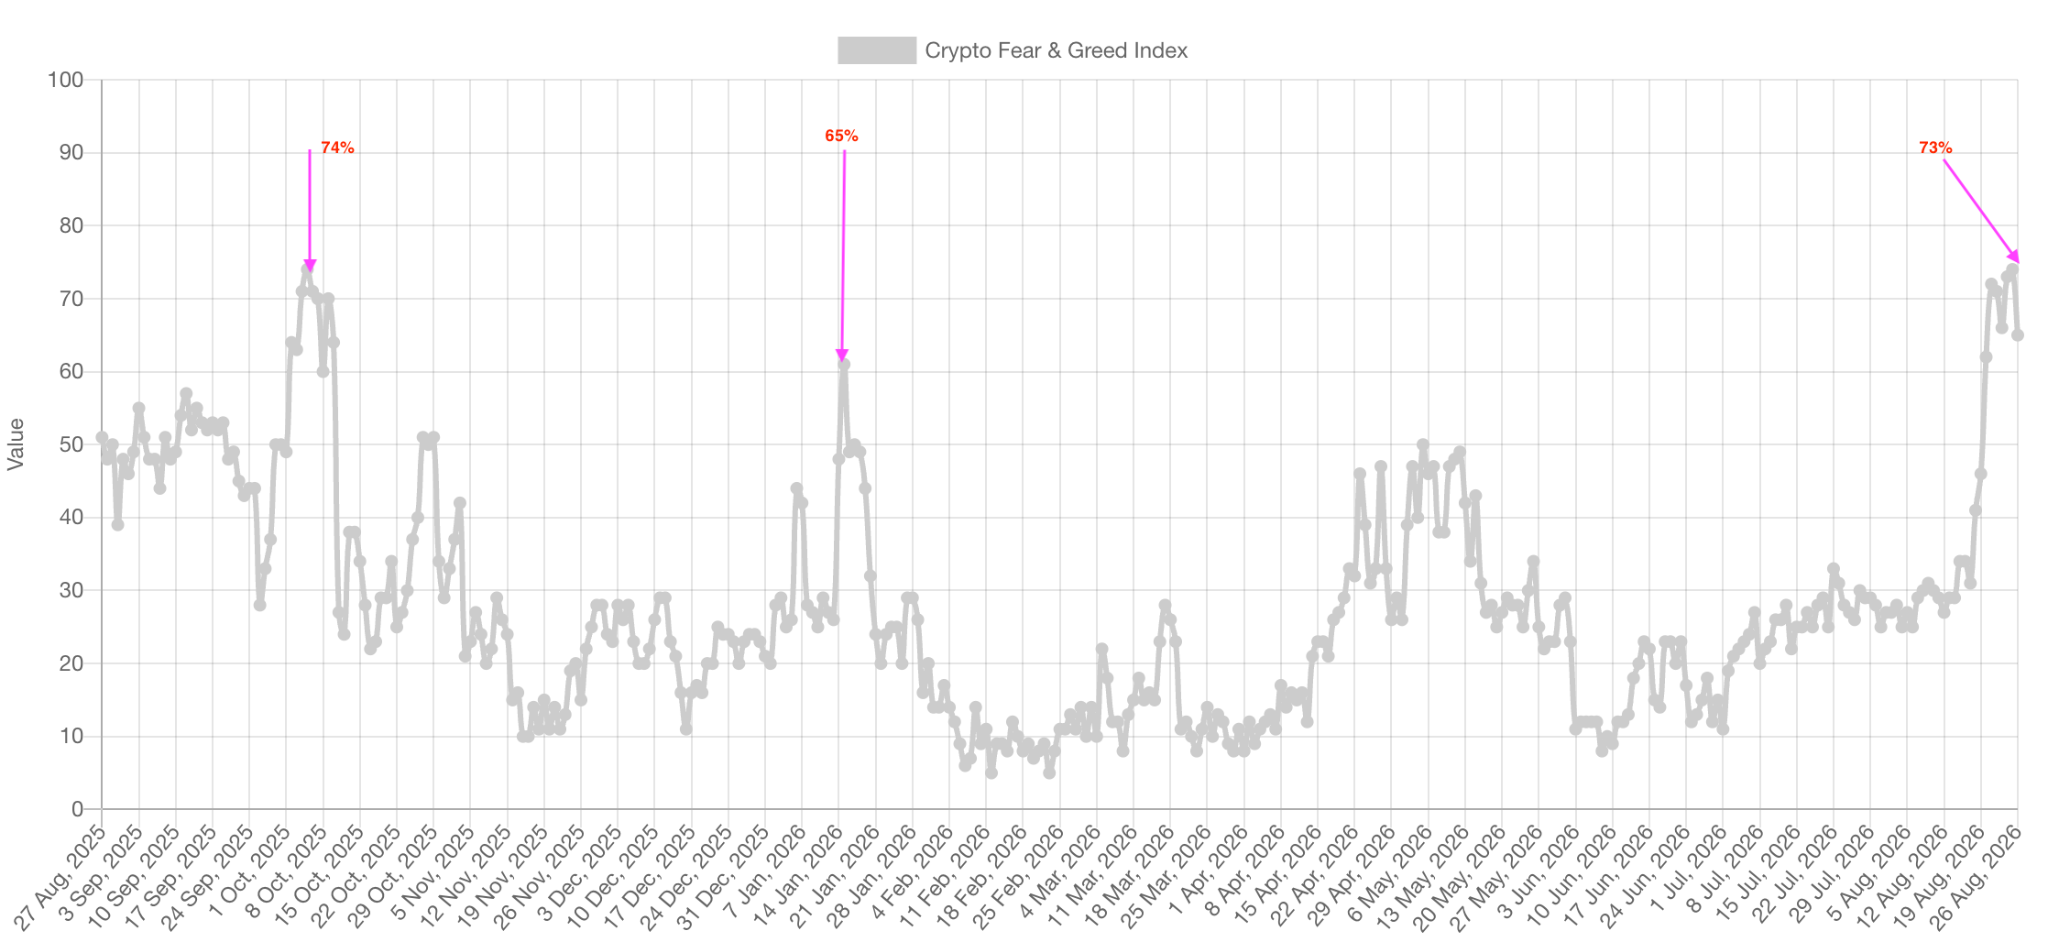
Crypto Fear and Greed Index. Source: Alternative.me
The Crypto Fear and Greed Index now stands at 73, a psychological level historically associated with consolidation before upside volatility. Spot Bitcoin ETFs recorded their strongest seven-day inflows of the year, signaling sustained capital entry into regulated vehicles. These data points diverge from typical consolidation behavior - accumulation, optimistic sentiment, and ETF inflows aligned together - creating a structural setup that historically precedes bull flag breakouts or sharp retests of support.
Technical Setup: Bull Flags and Moving Average Alignment
On the four-hour chart, Bitcoin has formed two overlapping bull flag patterns with targets near $95,330, resting on support from the 50-day moving average at $66,000 to $68,000. Bull flags form when accumulation and distribution remain balanced but buyers control price discovery; breakouts require sustained volume confirmation. The alignment between whale accumulation data (122,000 BTC added in four weeks) and these chart structures suggests institutional participation in the consolidation phase, a behavioral signal that buyers are using pullbacks to add exposure rather than distribute. Volume profile analysis at the $85,000/$87,000 zone shows historical cost-basis concentration; if institutional buyers hold positions through this level, it validates continued upside momentum. Conversely, volume drying up during the next four-hour consolidation would signal distribution risk and flag invalidation.
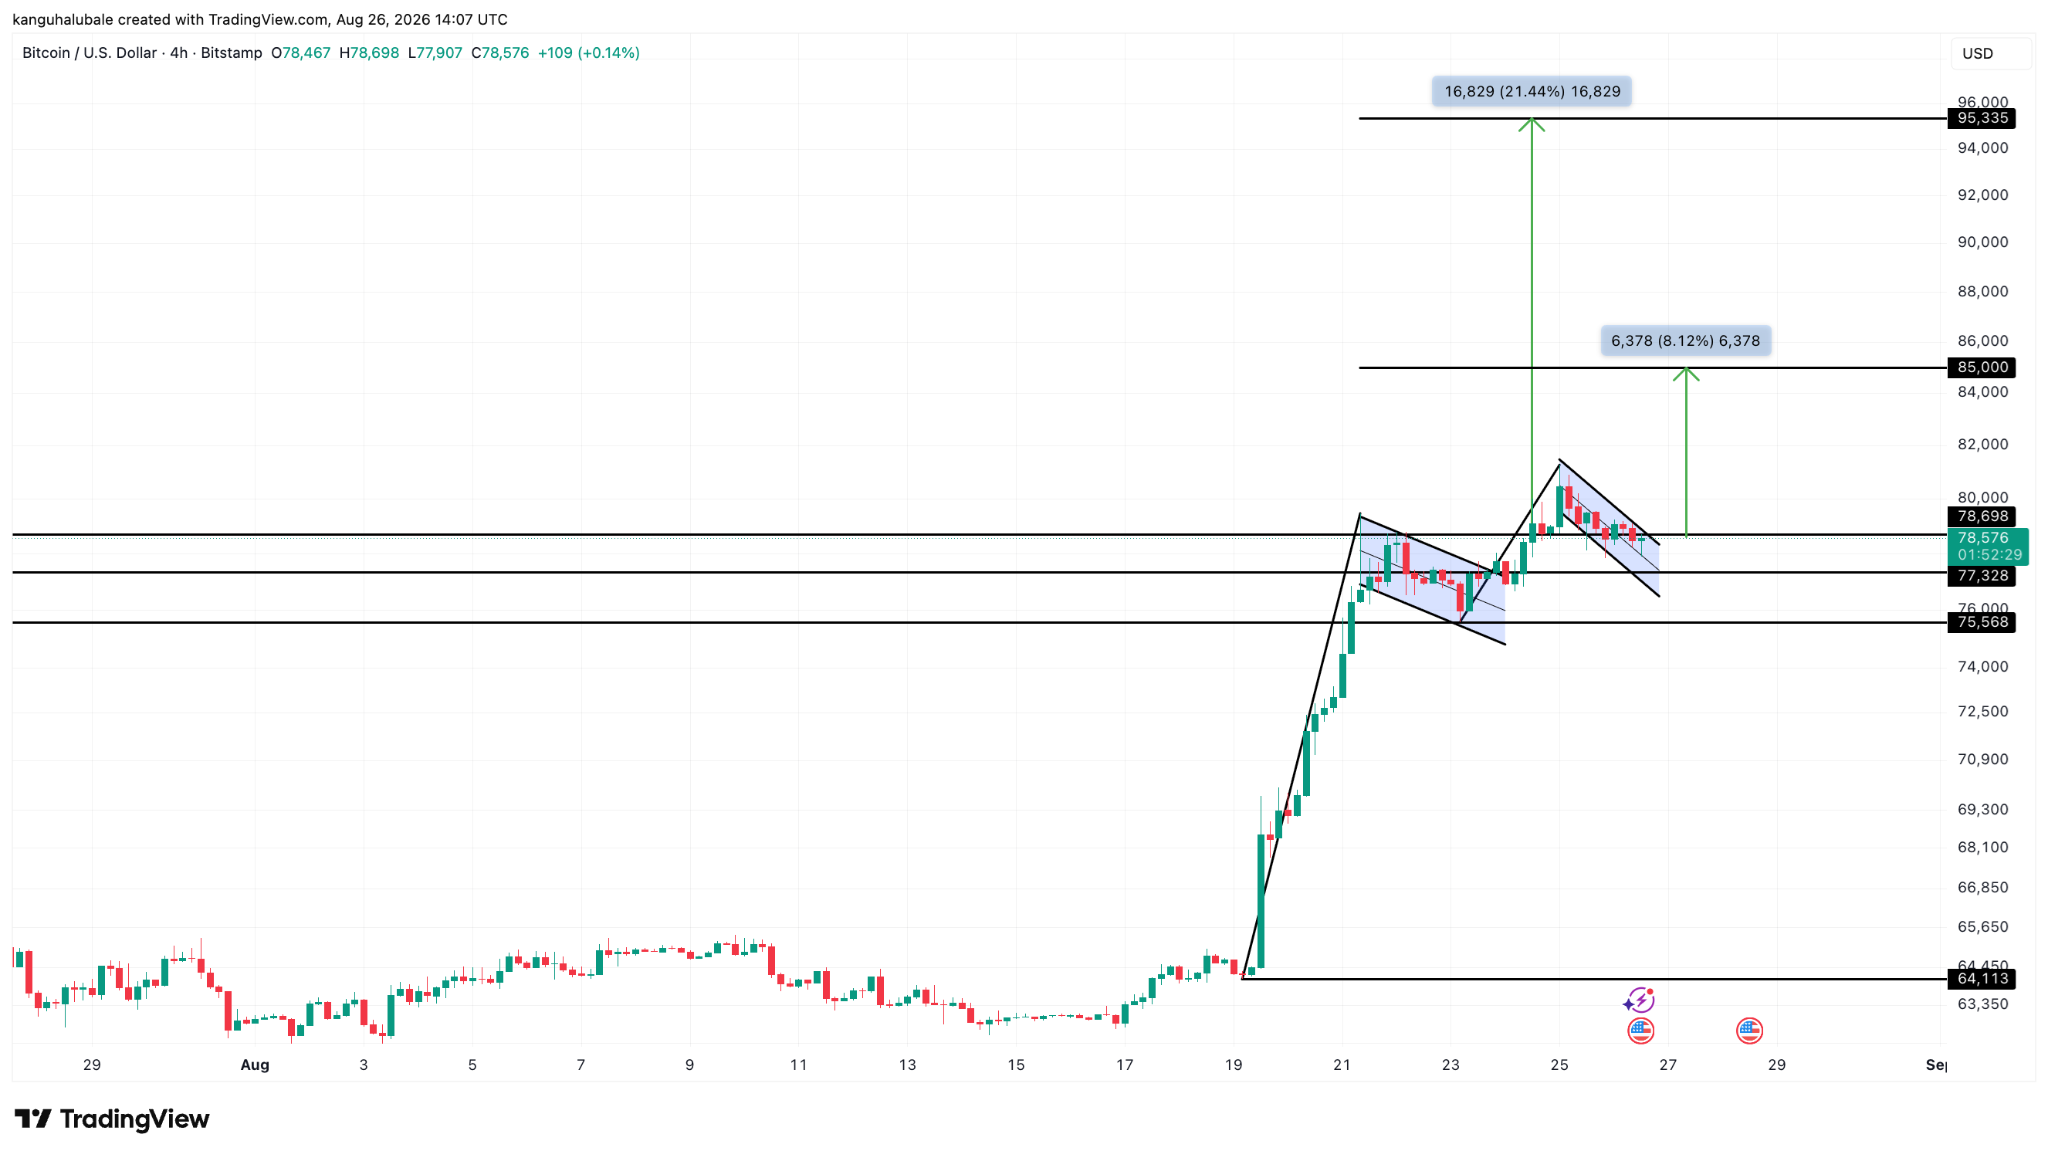
BTC/USD four chart. Source: TradingView
Spot ETF Capital Flows as a Structural Indicator
US spot Bitcoin ETF inflows hit $2.1 billion in the past seven days, the strongest weekly total of 2024, with consistent daily inflows signaling sustained institutional appetite. ETF capital matters because it represents conviction in multi-week holding periods rather than tactical noise; when ETF flows accelerate alongside on-chain whale accumulation, the two signals reinforce structural institutional confidence. This bifurcated entry (direct wallet accumulation plus regulated ETF purchases) masks a potential vulnerability: if capital flows originate from portfolio rotation (not new money), ETF inflows could reverse sharply without warning, exposing the accumulation narrative as temporary tactical positioning. The appearance of simultaneous whale and ETF accumulation thus indicates a mismatch between the confidence these signals suggest and the actual sustainability of capital flow. Watch for three consecutive days of negative ETF flows as a reversal signal.
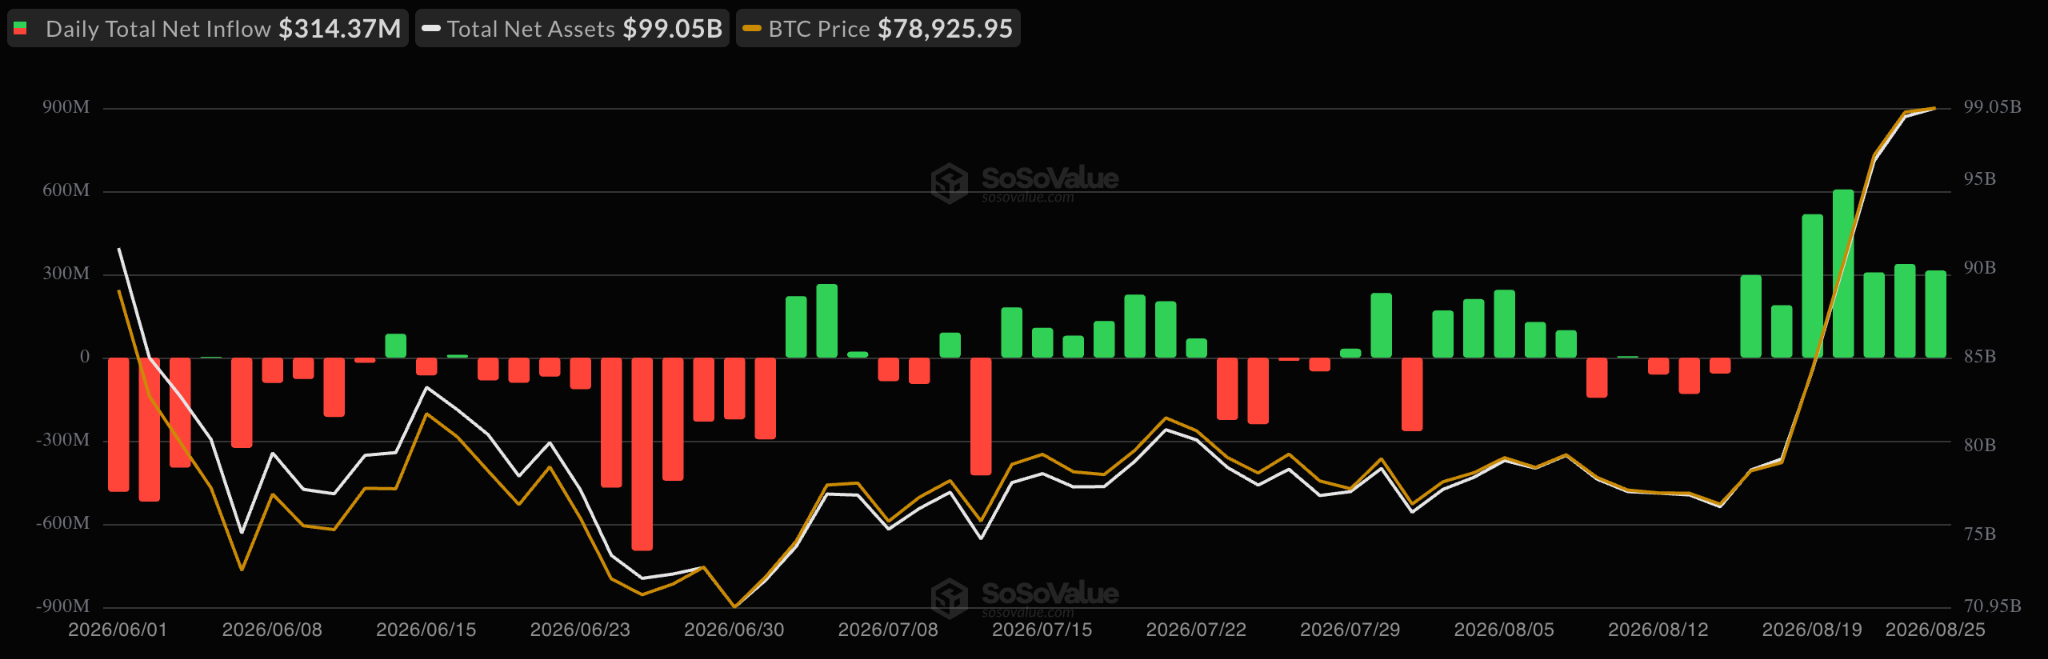
Spot Bitcoin ETF flows data. Source: SoSoValue
Open Interest and Futures Market Positioning
Bitcoin futures open interest stands near $78 billion, with long positions outnumbering shorts at approximately 1.8:1, a setup that amplifies volatility in both directions. Elevated open interest historically precedes sharp rallies when support holds and liquidation cascades when sentiment shifts abruptly. This asymmetry suggests vulnerability: while the long-to-short ratio appears bullish, it also indicates that a moderate sell-off could trigger cascading liquidations that accelerate downside far beyond fundamental warrant. The concentration of leverage among bullish traders masks a structural fragility: the same capital positioning that fuels breakout momentum could evaporate in minutes if a macro event (Fed decision, ETF reversal, or hawkish central bank commentary) triggers a sentiment reset. Open interest spikes historically peak just before volatility shifts, exposing overconfident positioning to sharp retracement risk.
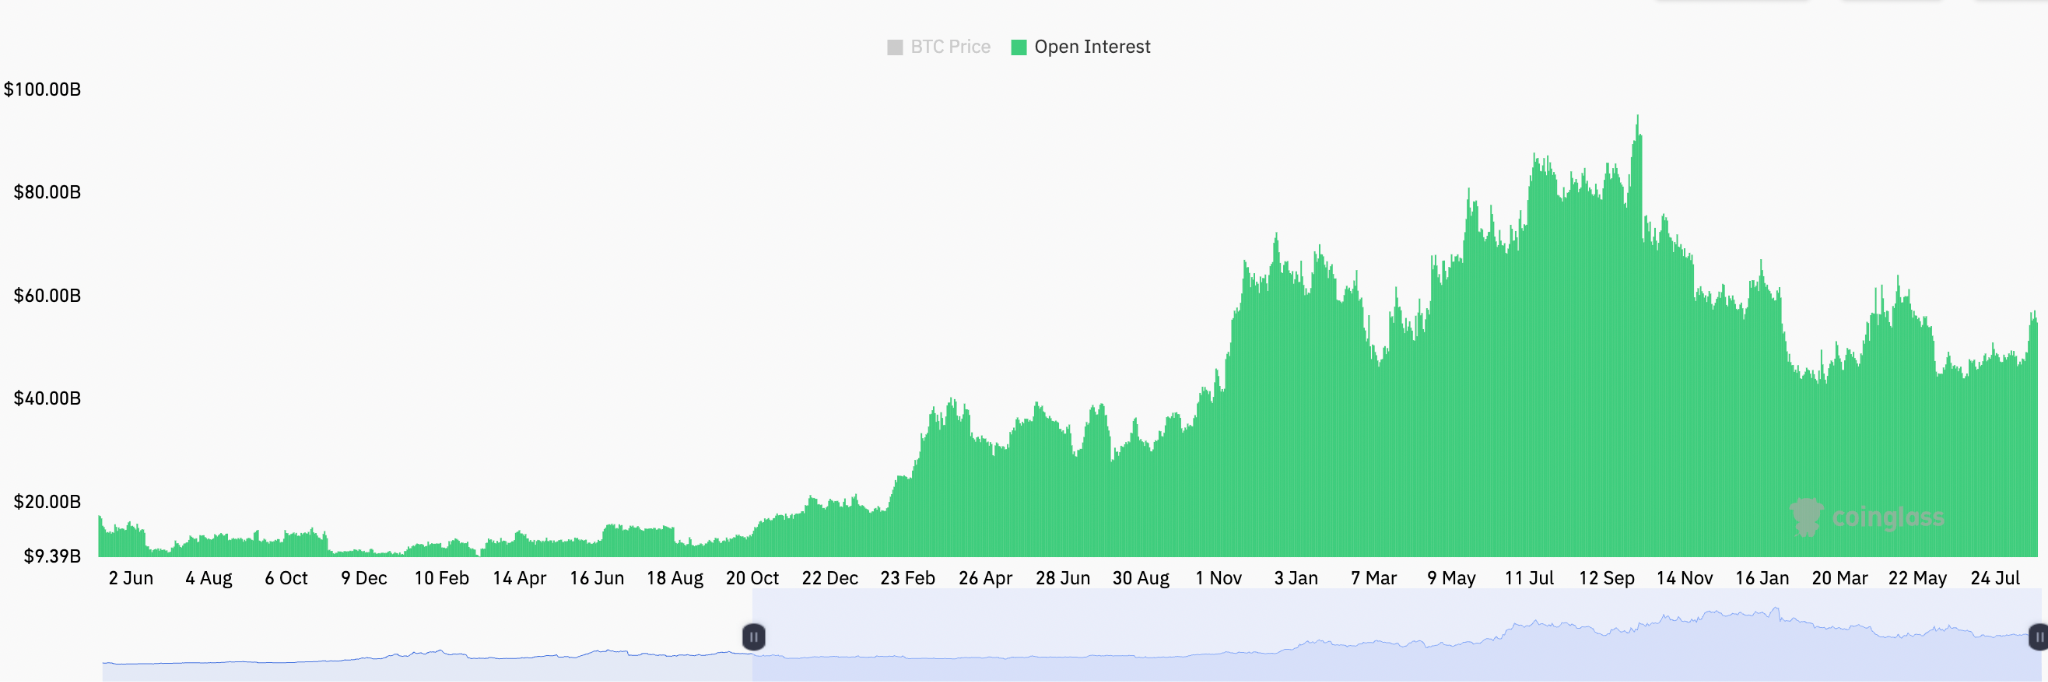
Bitcoin futures aggregate open interest, USD. Source: CoinGlass
Bitcoin's bull flag structures and whale accumulation patterns align with spot ETF inflows at year highs, a confluence that challenges the prevailing consolidation narrative and suggests institutional conviction toward breakout toward $95,000. The structural setup is compelling - on-chain data shows accumulation, technical patterns confirm buyer discipline, and regulated capital flows validate institutional participation, yet the same signals mask a behavioral vulnerability: retail complacency (Fear and Greed at 73) and elevated leverage (open interest near $78 billion) expose positioning to rapid reversal if a macro catalyst (ETF outflow reversal, Fed commentary shift, liquidation cascade) triggers sentiment reset. Watch for confirmation or rejection of the bull flag structure at the $85,000/$87,000 zone where on-chain cost basis concentrations historically trigger volatility; institutional positioning will clarify whether accumulation reflects strategic conviction or tactical rotation into a distribution event.
Ready to trade our analysis of Bitcoin? Here’s our list of the best MT4 crypto brokers worth reviewing.