


Today’s Gold Analysis Overview:
Gold's overall trend: Bearish in the medium term with a short-term upward correction.
Today's Gold Support Points: $4,050 – $4,000 – $3,940 per ounce.
Today's Gold Resistance Points: $4,170 – $4,220 – $4,300 per ounce.
Today's Gold Trading Signals:
Bullish Scenario: Buy gold from the support level of $4,020 with a target of $4,200 and a stop loss at $3,980.
Bearish Scenario: Sell gold from the resistance level of $4,200 with a target of $4,100 and a stop loss at $4,260.
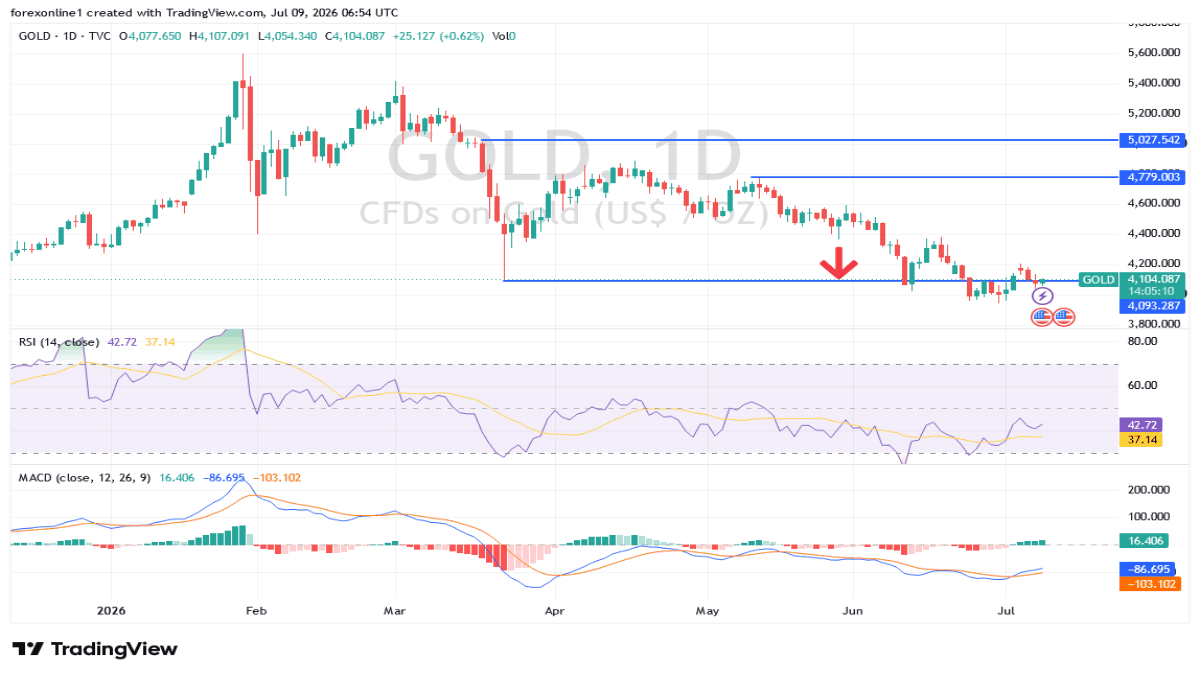
Note: These recommendations are suitable for medium-to-long-term traders, provided there is strict adherence to capital and risk management
Daily Technical Analysis of Gold/US Dollar (XAU/USD)
Gold recovered part of its recent losses after buyers found support near the $4,020 per ounce area, benefiting from a decline in the US Dollar's momentum after markets absorbed the Federal Reserve meeting minutes. Across gold trading company platforms, prices rose today to the resistance level of $4,110 per ounce.
Top Regulated Brokers
Regarding market influence factors, investors are anticipating any new statements from Federal Reserve officials in the coming hours, alongside developments in US Treasury yields and US Dollar movements, as these factors will remain the primary driver for gold's short-term direction.
Technically, the gold price analysis continues to move within a bearish trend on the daily timeframe. However, prices have begun to show corrective rebound attempts following the recent sell-off. Traders are currently waiting to see if this upward movement possesses enough momentum to turn into a broader recovery wave within an ABC corrective pattern.
The 14-day Relative Strength Index (RSI) is attempting to head toward the neutrality line to avoid further technical selling pressure. Similarly, the MACD indicator has begun to reduce its negative momentum but has not yet given a confirmed signal of a trend reversal, which supports the continuation of the corrective rebound without changing the general negative outlook.
Despite this rebound, the 20-day Exponential Moving Average (EMA) still poses a technical barrier to the continuation of the rise, given that the moving average retains its downward slope, reflecting that the main trend remains under selling pressure. Furthermore, the gradual decline of resistance levels indicates that buyers have not yet succeeded in establishing full control over the market.
Conversely, the appearance of a Doji candlestick pattern on the daily chart is an early indication of weakening selling pressure, but this needs to be confirmed by daily closes above nearby resistance levels, especially with prices holding above the key psychological level of $4,000. This development reinforces the likelihood of a continued corrective rebound in the short term, particularly as gold enters a seasonal period that historically tends to support limited positive performance.
Based on these data, the most likely scenario remains the continuation of the corrective recovery toward higher resistance levels within wave C of the ABC pattern. This scenario remains contingent on the ability of prices to maintain their trading above the $4,000 level and break through the resistance represented by the 20-day EMA.
On the bullish side, price stability above $4,200 per ounce resistance will be crucial for buyers to gain greater control over the market.
Trading Advice:
The gold price will remain in its bearish bias if the US Dollar is strong. Regardless of your investment conviction to buy or sell, adhering to strict risk management and position sizing is your only key to staying in the market.
Ready to trade our Gold forecast? We’ve shortlisted the most trusted Gold brokers in the industry for you.