


Fundamental Analysis & Market Sentiment
I wrote on 5th July that the best trades for the week would be:
Long of the USD/JPY currency pair. This produced a gain of 0.21% over the week.
Short of the EUR/USD currency pair. This produced a gain of 0.16% over the week.
The total gain of 0.37% averages to 0.19% per asset.
A summary of last week’s most important data in the market:
FOMC Meeting Minutes – showed members were tilting just a fraction hawkish and were split on the course of interest rates.
US ISM Services PMI – just a fraction lower than expected.
Reserve Bank of New Zealand policy meeting – hiked Official Cash Rate by 0.25% as expected, and signaled further hikes are likely, which was a hawkish tilt. This helped make the NZD the major gainer within last week’s Forex market.
Canadian Unemployment Rate & Employment Change – the rate fell unexpectedly from 6.6% to 6.5%.
The big story last week was the Federal Reserve’s minutes of its most recent policy meeting, which showed that members were a little more hawkish on rates than had been widely thought.
Top Regulated Brokers
Another major item was the more hawkish RBNZ, which sent the Kiwi higher. It was a very light week in terms of news. The major story away from economic data releases is the deterioration of the former ceasefire between the USA and Iran into daily exchanges of fire centred around the Strait of Hormuz. The Strait is effectively closed to shipping, and Iran has launched attacks against US allies Bahrain, Kuwait, Qatar, Jordan, Iraq. This started to affect the crude oil market towards the end of last week as the security situation deteriorated, and unless there is some major announcement elevating the ceasefire today, we can expect the price of crude oil to rise when markets open this week.
It is noteworthy that the USA/Iran situation does not in itself seem to be harming the performance of stock markets much.
The Week Ahead: 13th – 17th July
Next week looks relatively light but includes some significant data items. The coming week’s most important data points, in order of likely importance, are:
US CPI (inflation)
US PPI
Fed Chair Warsh Testifies to Congress
Bank of Canada Policy Meeting
UK GDP
It is a public holiday in France on Tuesday.
Monthly Forecast July 2026
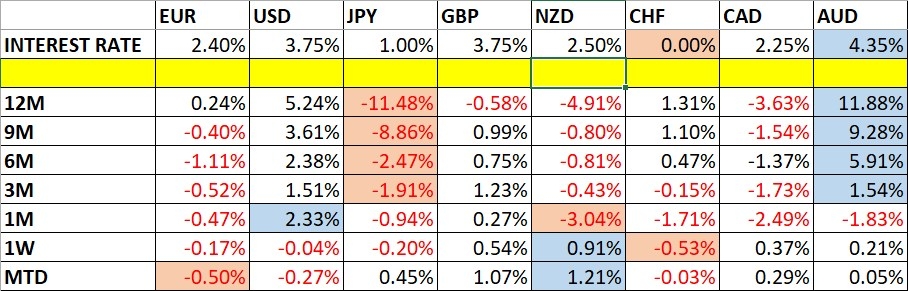
Currency Price Changes and Interest Rates
For the month of July, I forecasted that the EUR/USD currency pair will decline in value, and the USD/JPY currency pair will rise in value. The performance so far is:

Weekly Forecast 12th July 2026
Last week, I made no weekly forecast.
This week, I again make no forecast, as there were no exceptional price movements last week.
Volatility increased last week, with 19% of the notable currency pairs and crosses moving by more than 1% in value. Next week’s volatility is likely to remain at a similar level, although it might be higher in US Dollar currency pairs.
You can trade these forecasts in a real or demo Forex brokerage account.
Technical Analysis
Key Support/Resistance Levels for Popular Pairs
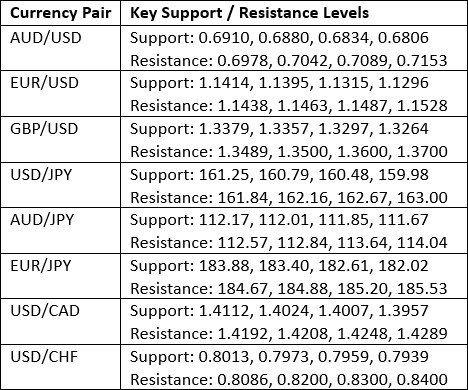
Key Support and Resistance Levels
US Dollar Index
The US Dollar printed an inside doji candlestick last week, signifying indecision, which closed higher and is positioned as a bullish candlestick threatening another breakout to a new 13-month high above the key long-term resistance level at 101.39.
A valid long-term bullish trend has clearly been established, with the price above its levels of both 3 months ago and 6 months ago, but its failure to break above resistance so far calls it into some doubt.
I am neutral on the US Dollar over the coming week – I will wait until we get a solid breakout above the key resistance level 101.39. The price is clearly undecided about that.
I could see this bullish breakout happening over the coming week, unlike last week – perhaps triggered by a higher-than-expected US CPI (inflation) print over the coming week.
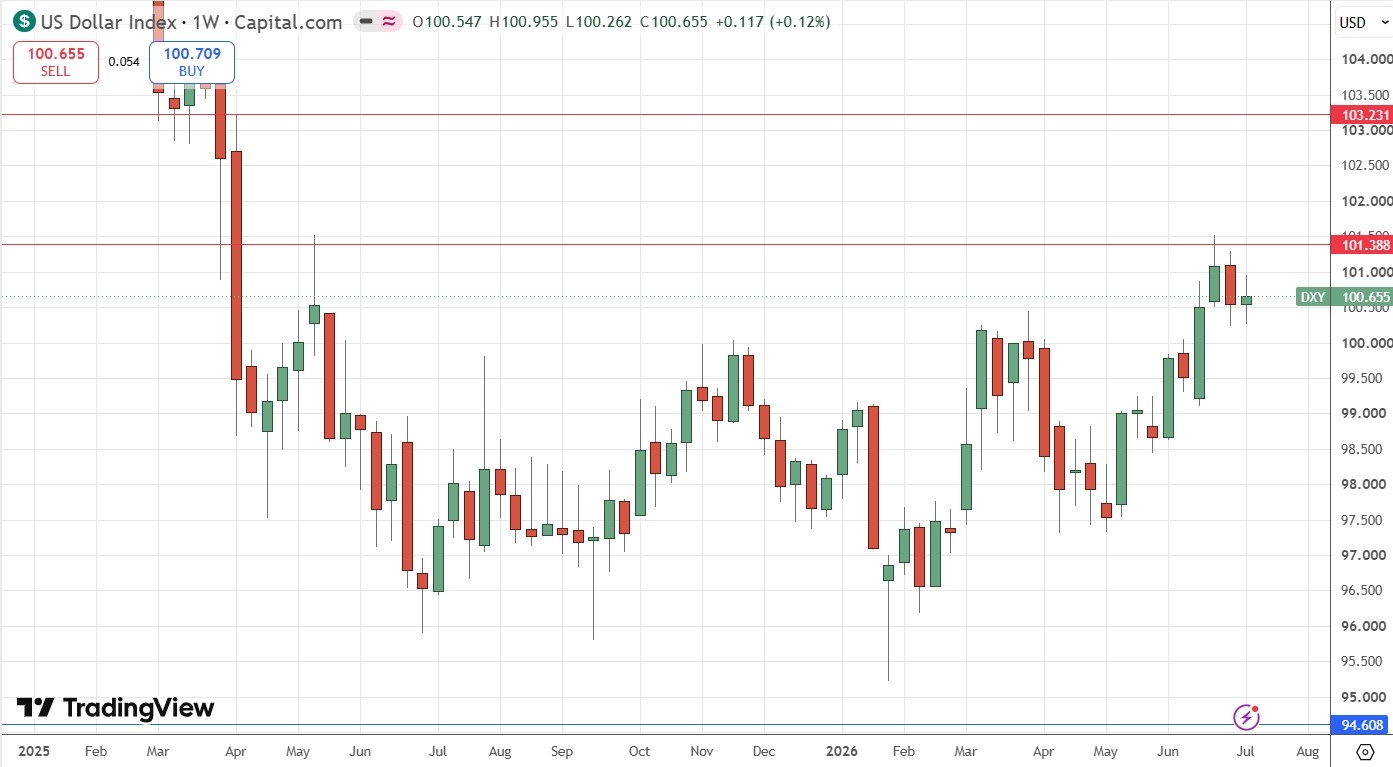
US Dollar Index Weekly Price Chart
USD/JPY
The USD/JPY currency pair was unable to reach a new 39-year high price last week, despite getting very close to it, printing an inside near-pin bar / hammer with bearish implications. There is no confirmation that the Japanese Financial establishment intervened to prop up the Yen, but this might have happened quietly.
The implications of this recent higher-volatility price action are bearish. However, the price is not far from the record high and there is clearly a very long-term bullish trend in force, with the price action supported by a rising trend line for over one year now.
There are fundamental reasons why the US Dollar is quite likely to remain strong, but the currency that many analysts see as having a long way to weaken further over the coming years is the Japanese Yen, due to the massive levels of national debt there.
I think the near future here will mostly depend on the US Dollar: if the DXY can break above the resistance at 101.39 then this currency pair should continue to reach new high prices.
I am long of this currency pair, as a trend traders.
I am very comfortable being long of this currency pair - as a longer-term trend trade, this pair still looks good. Look at that supportive ascending trend line shown in the price chart below which stretches all the way back to April 2025.
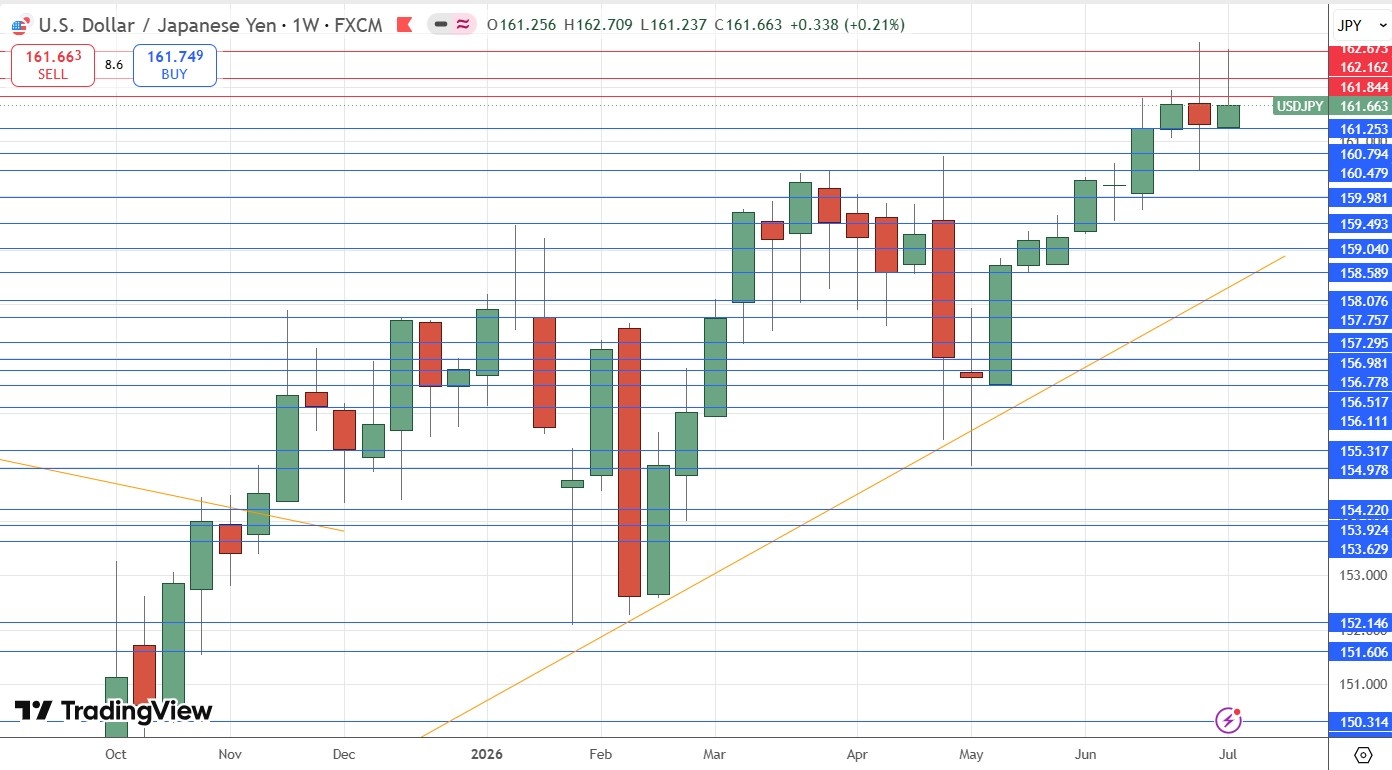
USD/JPY Weekly Price Chart
EUR/USD
The EUR/USD currency pair was looking likely to make a serious bearish breakdown and did briefly reach new long-term low prices, drawing in many trend traders like me on the short side. However, it made quite a natural recovery last week, generating a relatively fat bullish candlestick. The Euro is certainly naturally less bearish than the Japanese Yen is.
I remain short here, but I am not very hopeful about this trade. However, there is a valid long-term bearish trend, and this pair does like to pull back so I will stick with it. It is easy to be put off by the usual deep retracements in this currency pair. The Euro is not a particularly strong currency, so I still see it as likely to be weaker than the US Dollar over the next few weeks.
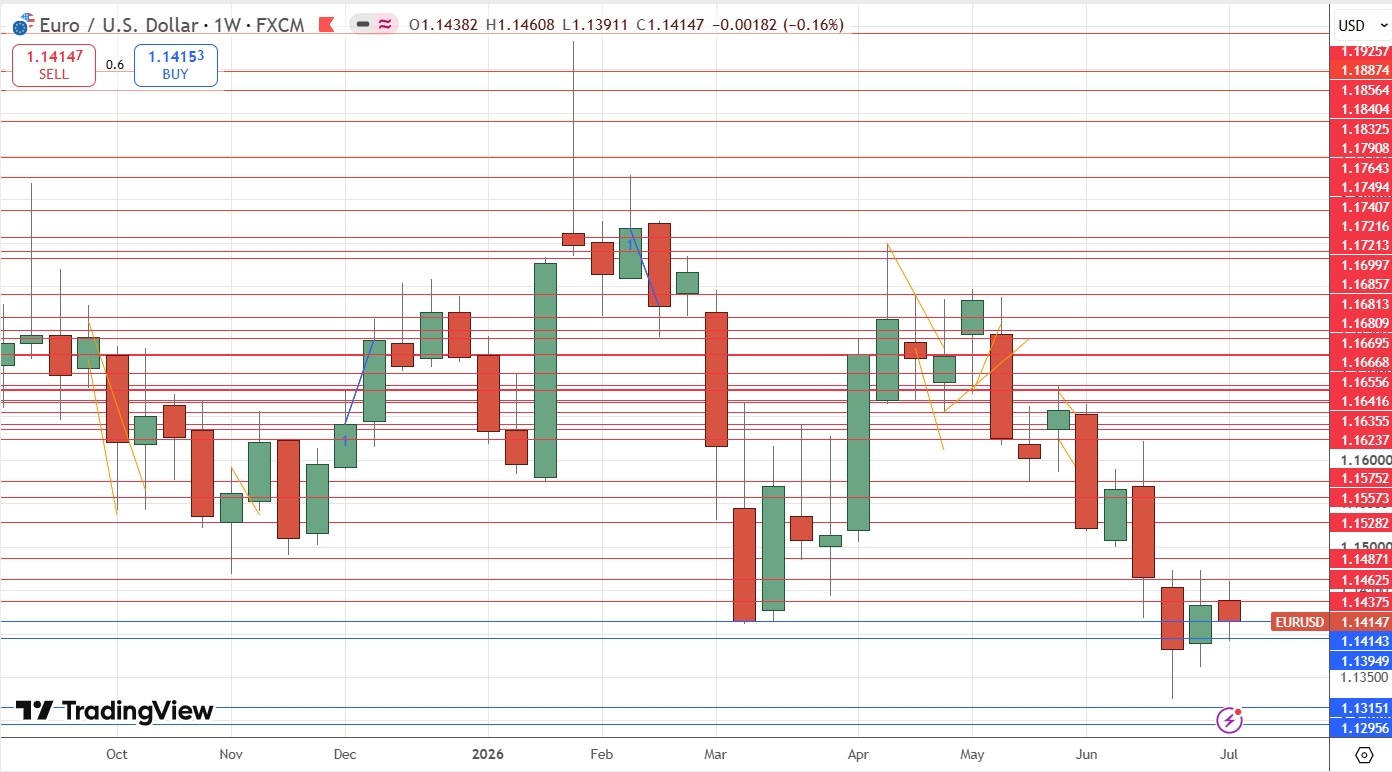
EUR/USD Weekly Price Chart
S&P 500 Index
The S&P 500 Index printed a strong bullish candlestick last week which closed at the highest ever closing price very near the high of its weekly range. The candlestick has a meaningful lower wick. These are all bullish signs, as is the fact that the S&P 500 Index is looking technically more bullish than the NASDAQ 100 Index, even though that latter technology index just made a bullish breakout from a narrowing triangle chart pattern.
This suggests that markets are turning their focus away from AI, which is finally starting to underperform the wider market. Given how overbought the AI sector is, this could persist.
Before going long here, I prefer to wait for a record daily closing price at or above 7,623. I am very optimistic about being long of a major US stock market index when it breaks to a new record high – the historical data precedents on this are very encouraging. Ignore the people worrying about a crash – that could always happen but don’t miss out on the chance of another leg higher!
US stock in general is “overbought”, but that does not mean they won’t continue to trade higher.
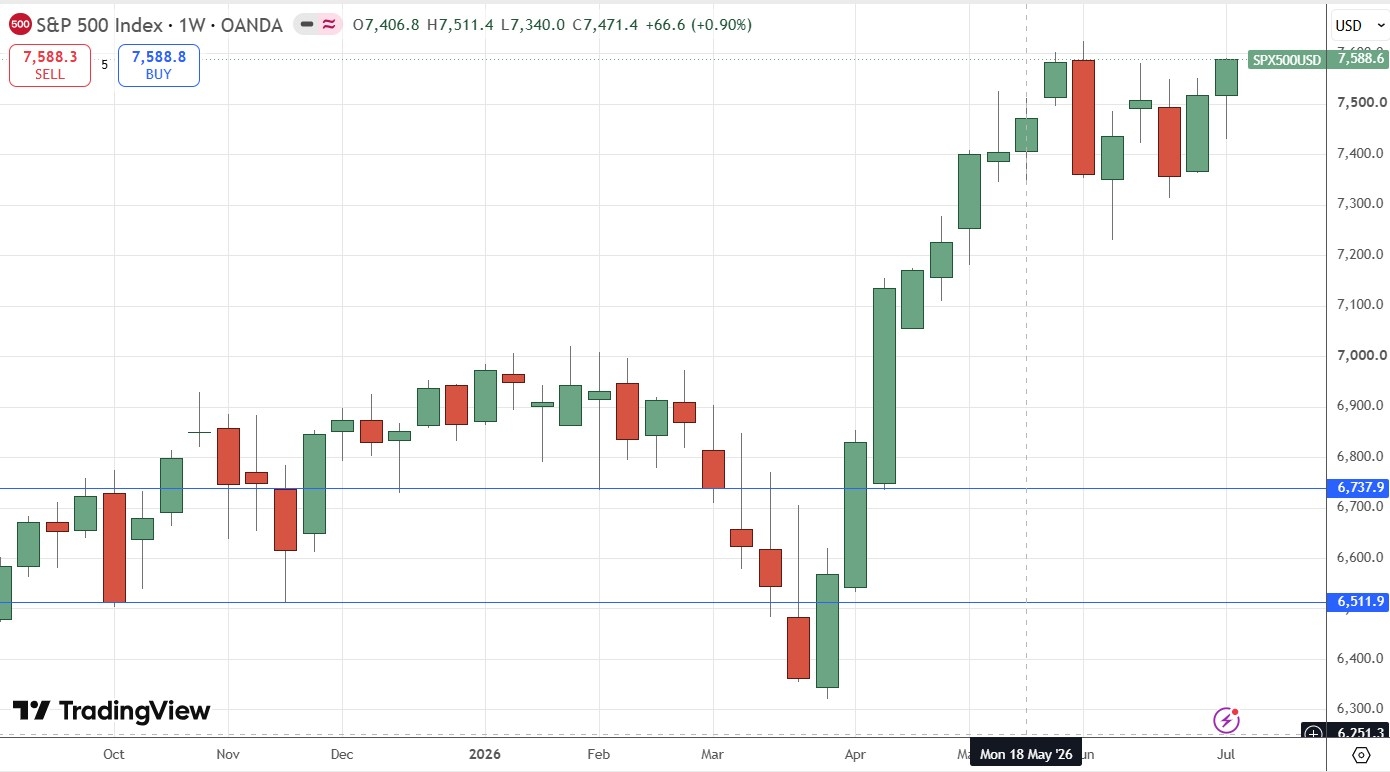
S&P 500 Index Daily Price Chart
Gold
Gold had a bearish candlestick last week, but the large lower week means it was only bearish in name and doesn’t really give us much bearish information or feeling. The descending trend line is still suppressing the price, but there are initial signs that things might be about to change.
If you are thinking of buying, it will likely be wiser once the trend line I mentioned is decisively broken. Next week, this trend line will be located at about $4,200.
It could be that Gold and Silver have finally found bottoms that are going to hold, at least for a few weeks. It has now been almost two weeks since the long-term low below $4,000 was tested. However, it will be best to wait for a decisive break of that trend line before entering a new long position in Gold.
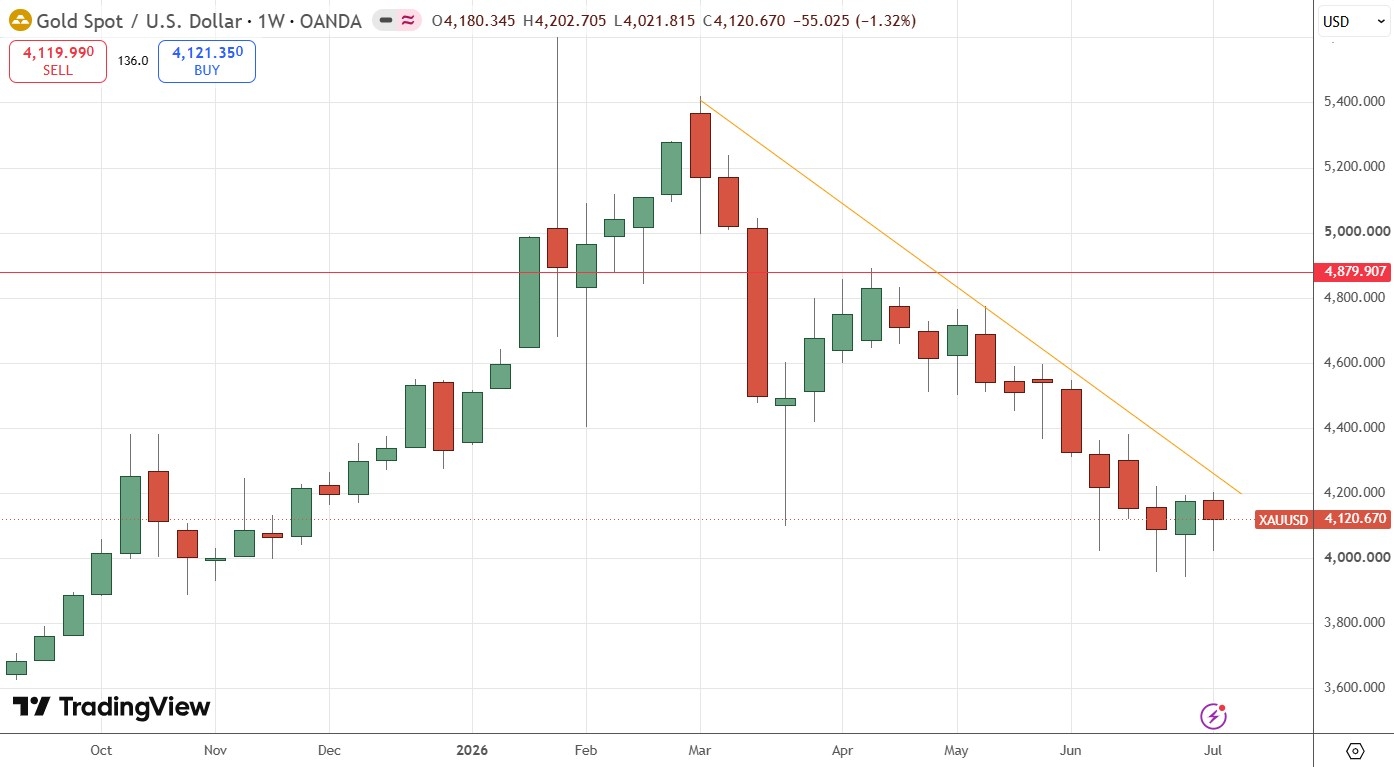
Gold Weekly Price Chart
WTI Oil Futures
WTI Crude Oil finally had an up week for the first time in quite a while, after reaching key support at $67.11 the week before last which is classic “stairstep” support as it previously acted as resistance. This was the area the price was trading in before the USA / Iran war started on 28th February earlier this year.
The ceasefire between the USA and Iran continued to deteriorate substantially last week, and this was the proximate cause of the rise over the week, although we can see from the significant upper wick that crude oil gave up much of its gain earlier in the week as the USA and Iran dialed down their military confrontation in the Strait of Hormuz and President Trump did not follow through with his comments about the ceasefire being “over”.
However, after this incident, the situation in the Strait has deteriorated again, with a stronger exchange of fire this weekend and Iranian attacks on several Gulf nations. The Strait is apparently effectively closed according to publicly available information, and if this does not change quickly, the price of crude oil is going to trade higher when markets open this week. President Trump may let it rise a little, but he will be placed in a major dilemma if the Iranians can cause enough impact over Hormuz to threaten to reignite crude oil price shock inflationary fears over the global economy.
I am not sure how much further it will go, but we may have a nice short-term buy here off $67.11. Day traders might choose to get involved on the long side during the US session if the price is rising.
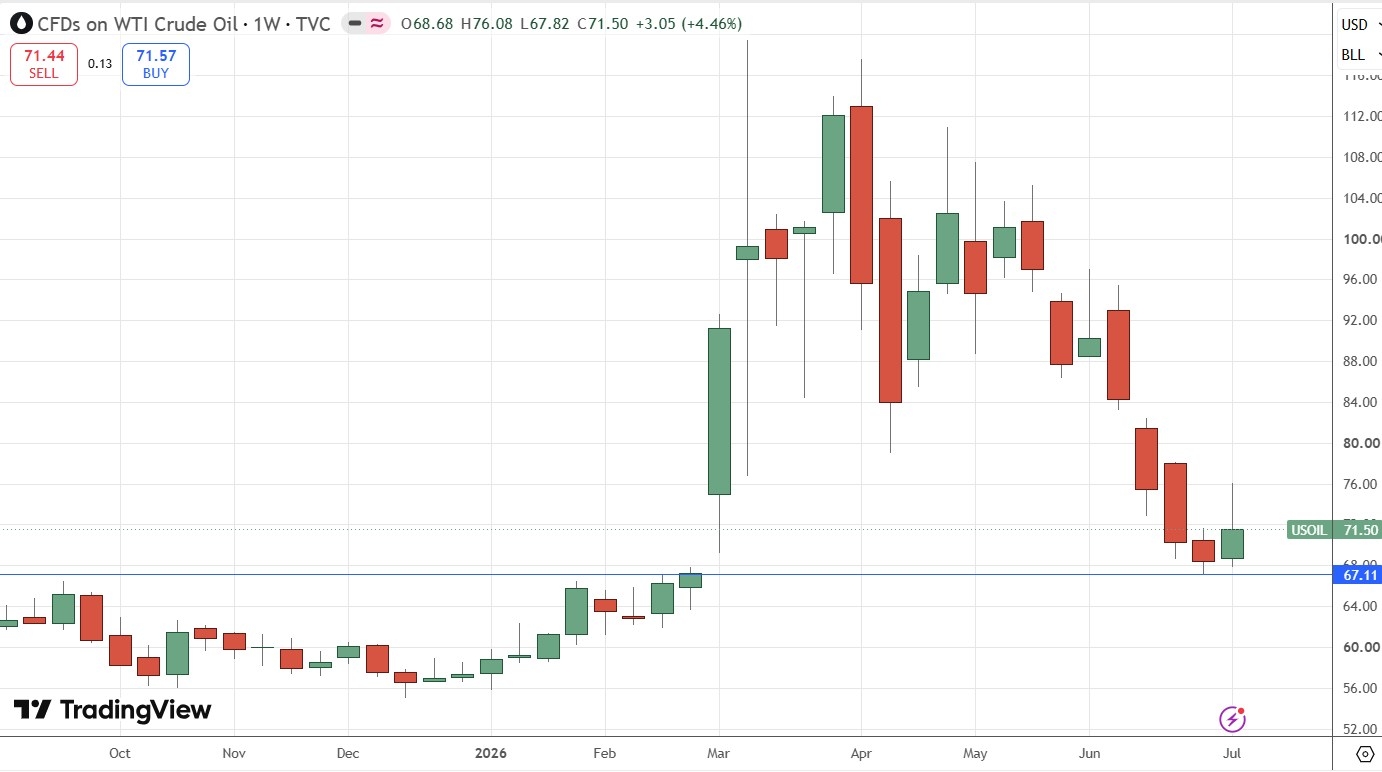
WTI Crude Oil Spot Weekly Price Chart
Bottom Line
I see the best trades this week as:
Long of the USD/JPY currency pair.
Short of the EUR/USD currency pair.
Ready to trade our weekly Forex forecast? Check out our list of the best Forex brokers.