


Bearish outlook
Sell the BTC/USD pair and set a take-profit at 60,000.
Add a stop-loss at 68,000.
Timeline: 1-2 days.
Bullish view
Buy the BTC/USD pair and set a take-profit at 68,000.
Add a stop-loss at 60,000.
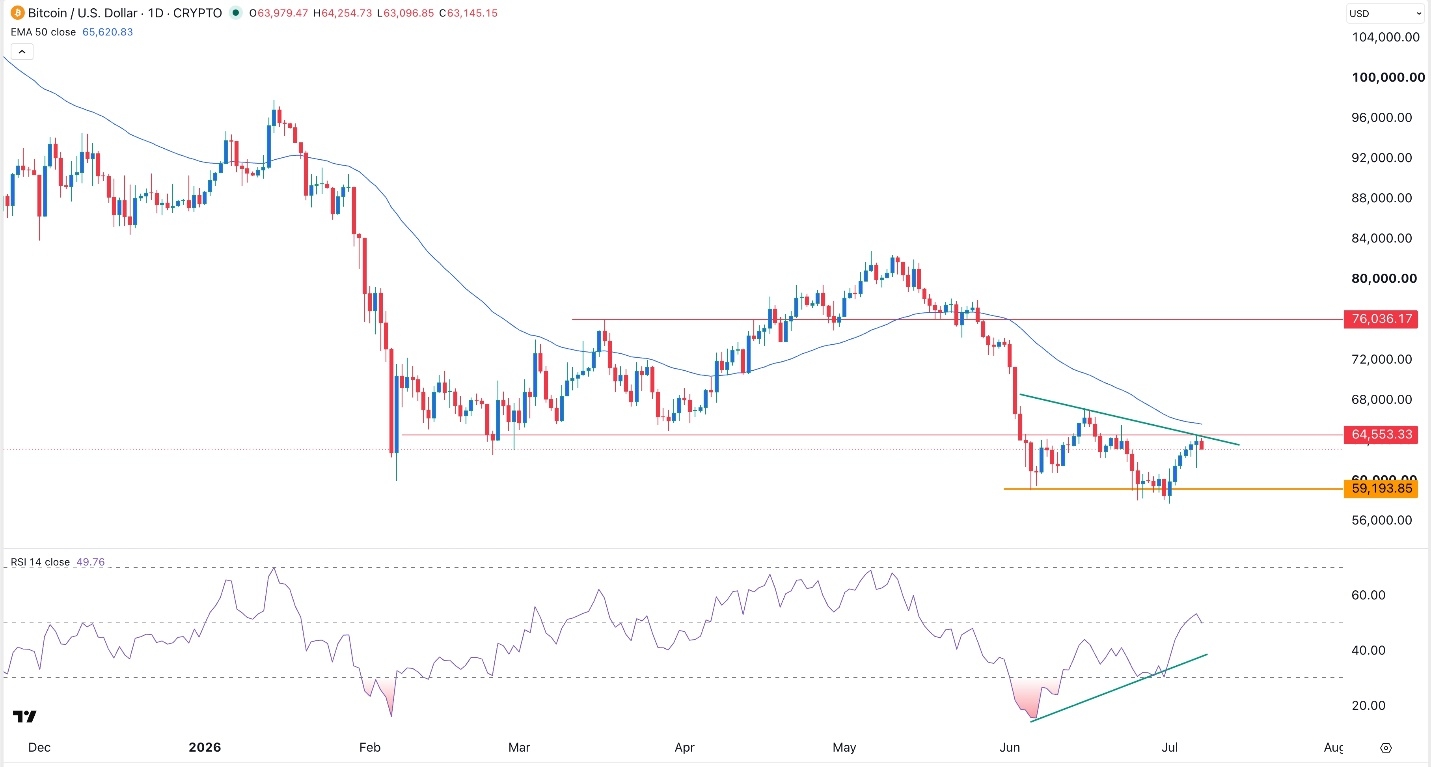
Bitcoin price continued its recent rebound as traders embraced a risk-on sentiment. The BTC/USD pair approached the psychological level of 64,000, even after Michael Saylor’s Strategy announced its biggest Bitcoin sale ever, and ETF outflows continued.
Top Regulated Brokers
Strategy is Selling Bitcoin Amid ETF Outflows
The BTC/USD pair jumped after Strategy, the biggest Bitcoin holder in the world, announced that it sold 3,588 coins worth over $216 million last week. This was the biggest sale the company has ever made and was in line with its previous guidance.
In a statement last week, the company said that it would sell Bitcoin worth over $1.5 billion to boost its cash reserves. Its goal is to ensure that it has enough cash to pay dividends to holders of its preferred shareholders.
Strategy is now selling its Bitcoin at a loss since the average buying price since it started its accumulation strategy was over $74,000. Also, the selling comes after Michael Saylor insisted that the company would never sell its coins.
Bitcoin held steady because the selling was in line with expectations. However, there is a risk that some of the other top Bitcoin treasury companies will start selling. This is important as these companies hold over 1 million coins, with most of them suffering substantial losses.
The BTC/USD pair rose as the US dollar softened and as investors embraced a risk-on sentiment. For example, US stocks resumed their uptrend, with the Dow Jones, S&P 500, and Nasdaq 100 rising by over 0.35%.
Bitcoin also held steady, even as spot Bitcoin ETFs continued to suffer outflows. These funds have now shed over $6 billion in outflows this year, with June being their worst month on record.
BTC/USD Technical Analysis
The daily chart shows that the BTC/USD pair has bounced back in the past few days. It soared from the year-to-date low of 58,000 to a high of 63,600.
Still, it is too early to predict whether this is the start of a bull run. For one, there are signs that it is losing momentum, with the Average Directional Index (ADX) falling to 29.7, its lowest level since June 2nd.
The BTC/USD pair has remained below the 50-day moving average. Therefore, the most likely scenario is where it resumes the downtrend, potentially to the key support of 60,000.
Ready to trade our daily Forex signals? Here’s a list of some of the best crypto brokers to check out.