


Bullish view
Top Regulated Brokers
Buy the BTC/USD pair and set a take-profit at 67,000.
Add a stop-loss at 60,000.
Timeline: 1-2 days.
Bearish view
Sell the BTC/USD pair and set a take-profit at 60,000.
Add a stop-loss at 67,000.
The BTC/USD pair has remained in a consolidation phase in nearly two months and is showing signs of bottoming ahead of the Federal Reserve interest rate decision. Bitcoin was trading at $63,700 on Wednesday, up from this month’s low of $57,200.
Bitcoin Wavers Ahead of the FOMC Decision
The BTC/USD pair held steady as traders waited for the July Federal Reserve interest rate decision that comes out later today.
Analysts have mixed opinions on what to expect in this meeting. While most economists expect the bank to leave interest rates unchanged, some expect it to deliver a surprise hike.
In a note on Monday, Citadel analysts predicted that the bank may decide to hike since inflation remains stubbornly high. The most recent data showed that the core inflation dropped to 2.5% in June, remaining above the 2% target for over five years. Bitcoin often reacts negatively to a hawkish Fed.
Bitcoin has wavered as demand for spot BTC ETFs has waned in the past few weeks. Earlier this month, these funds added ETFs for eight consecutive days, a trend that has largely stalled in the past few days.
BTC is also stalling as investors react to the fading optimism that the Senate will pass the CLARITY Act. Polymarket data shows the odds that the act will be signed into law. It has dropped to 34% because of the provision that would ban Trump and his family from launching meme coins.
BTC/USD Technical Analysis
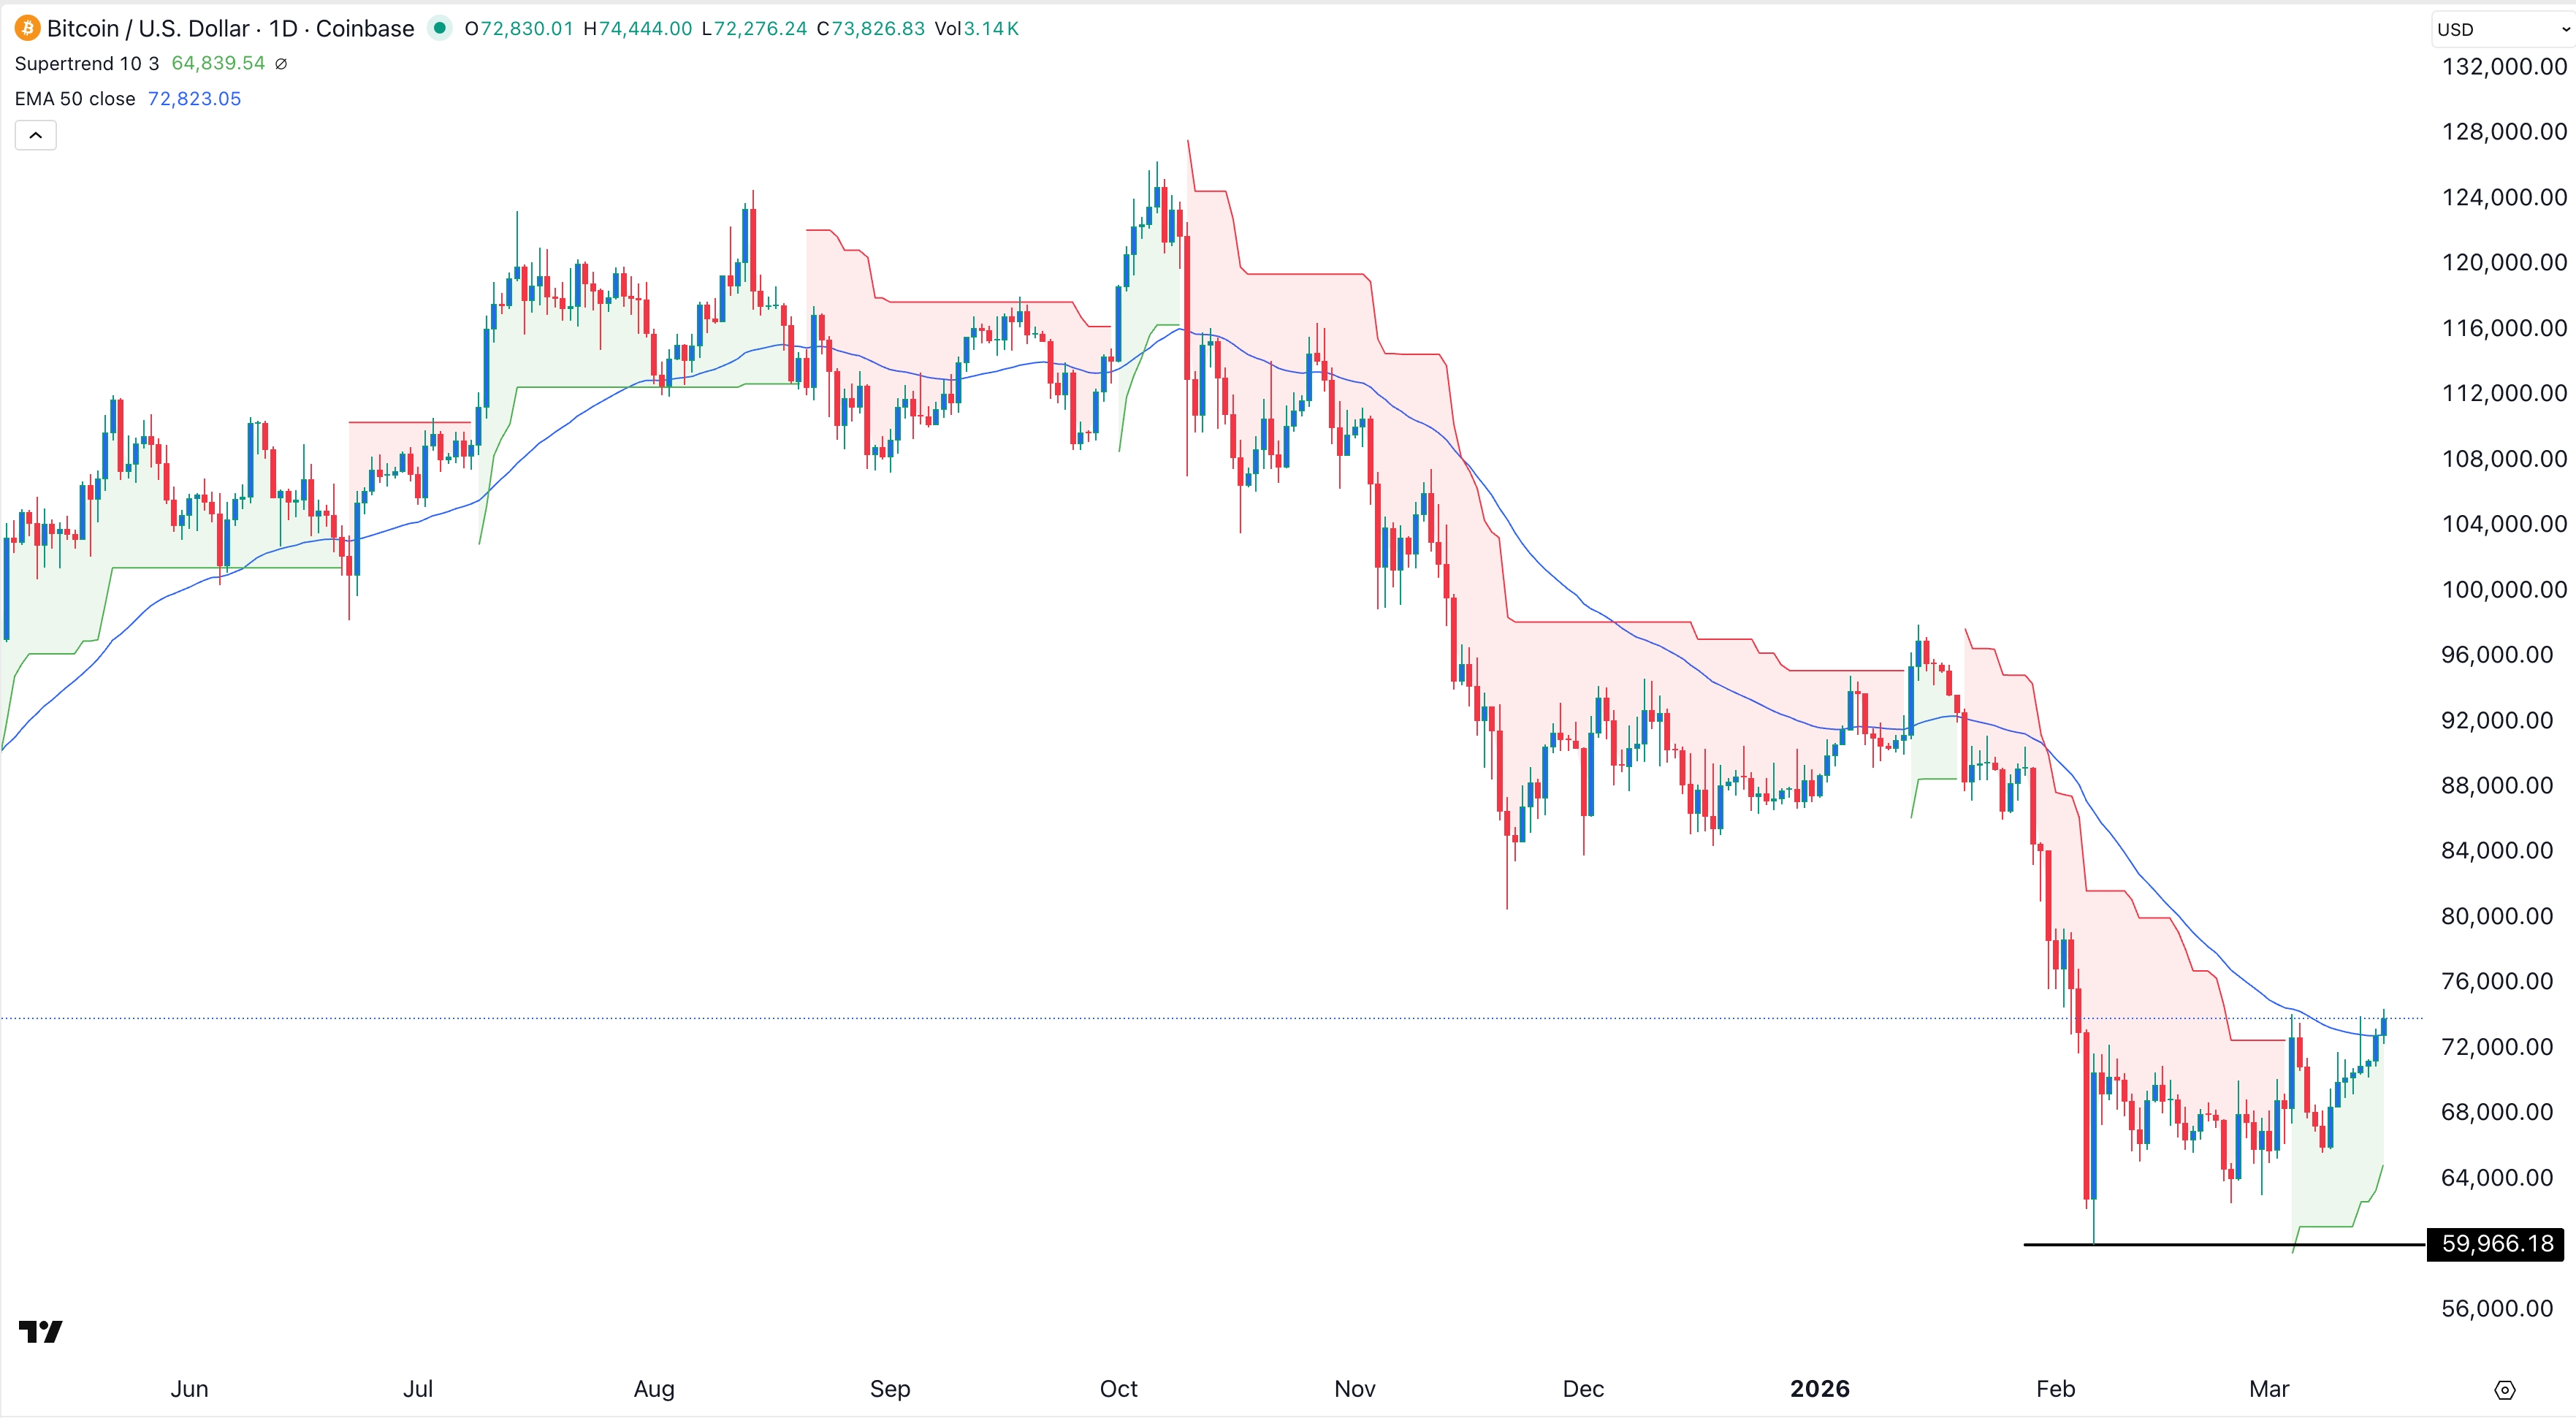
Bitcoin price has been in a strong downward trend in the past few months. After peaking at $126,200 last year, it has now plunged to the current $63,665. It has remained below the 100-day and 200-day Exponential Moving Averages (EMA). Remaining below these averages suggests that bears are still in control.
At the same time, the pair has formed what looks like a double-top pattern at $66,820 and a neckline at $57,655, its lowest point on July 1.
The BTC/USD pair’s Percentage Price Oscillator (PPO) have continued rising and recently cross the zero line. Therefore, there are signs that the coin is bottoming, which may push it higher. This view will be confirmed if it jumps above the key resistance level of 66,820. A move above that level will point to more gains, potentially to 70,000.