


This currency pair has been rising in a fairly disorderly way since late June, after undergoing a period of sinking. The sinking was due to a strengthening US Dollar, which at one point broke out to a new 1-year high price. Yet most of the rise of the past few weeks has been due more to strength in the Australian Dollar, or at least relative strength.
I think it is hard to see what might bring the AUD/USD currency pair to the forefront of the Forex market right now. It no longer acts so reliably as a risk barometer and became more of a local currency pair. Perhaps the major driver questions are what the Reserve Bank of Australia will do, and what impact a potential escalation between the USA and Iran might do to both the US Dollar and the Australian Dollar as a commodity currency. The answers are not clear here, so it might just be that as Australia has the highest interest rate of any major currency, it will tend to rise over the short-term, and if the US Dollar will continue to be held by the resistance level in its Index at 101.39, then all other things being equal, any external drivers will tend to push the price of this currency pair higher.
Top Regulated Brokers
AUD/USD Technical Analysis
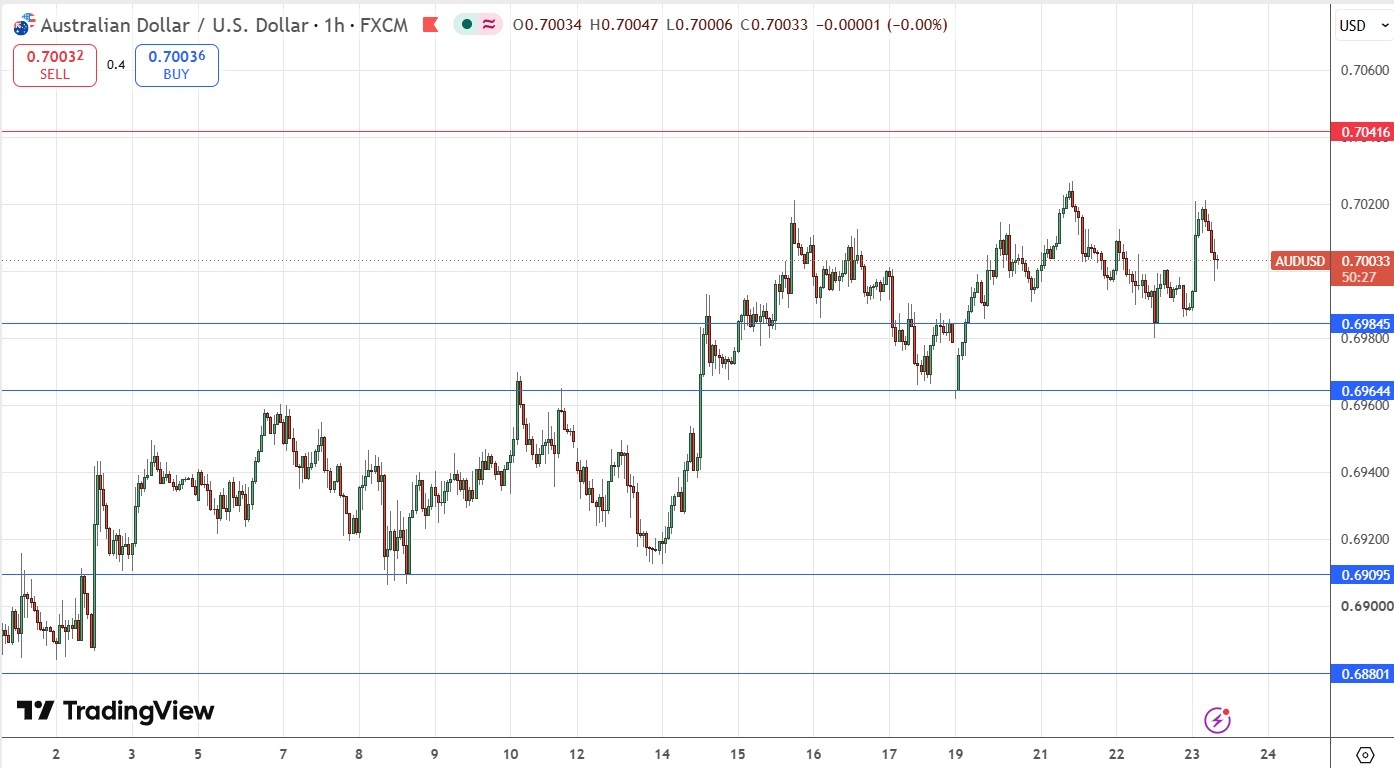
Turning to the technical side, we saw a bullish breakout from a descending linear regression analysis in late June, which has continued to drive the price higher, but in a disorderly way. There are no clean channels or even trend lines which can truly be drawn accurately to contain the price action of the last three or four weeks.
Although the price has got above the psychological level and major round number at $0.7000, it now seems to be struggling to move meaningfully higher. This might be a bearish sign. The price chart below shows a potential triple top at $0.7020, although it could be said this is also a bearish head and shoulders – but where is the neckline if that is true? Arguably, at the support level of $0.6364.
My Take on AUD/USD
The triple top / head and shoulders is the dominant short-term feature of this price chart. It makes sense to say if the price breaks below the neckline support at $0.6364 that will be a bearish sign, and alternatively, if the price breaks to a new high above the highest point of the triple top at $0.7027, that will be a bullish sign.
A short trade would probably best be entered once its clear the break below $0.6364 is decisive and showing short-term momentum downwards. A long trade will be trickier, because there is resistance not far above $0.7027, at $0.7042, so it might be wiser to wait for a decisive bullish breakout above that latter level before entering a new long trade.
Another alternative might be a long from a failed breakdown below the neckline at $0.6364, or a short from a failed breakout above $0.7027.
Review, Support & Resistance Levels
My previous AUD/USD signal on 13th July was not triggered, as unfortunately the low of the day was a few pips above the given support level.
Risk 0.25%.
Trades may only be entered prior to 5pm Tokyo time Friday.
Short Trade Ideas
Short entry following a bearish price action reversal on the H1 time frame immediately upon the next touch of $0.7042 or $0.7089.
Put the stop loss 1 pip above the local swing high.
Move the stop loss to break even once the trade is 20 pips in profit.
Remove 50% of the position as profit when the price reaches 20 pips in profit and leave the remainder of the position to ride.
Long Trade Ideas
Long entry following a bullish price action reversal on the 1H1 time frame H1H1H1 time frame immediately upon the next touch of $0.6985 or $0.6964.
Put the stop loss 1 pip below the local swing low.
Move the stop loss to break even once the trade is 20 pips in profit.
Remove 50% of the position as profit when the price reaches 20 pips in profit and leave the remainder of the position to ride.
The best method to identify a classic “price action reversal” is for an hourly candle to close, such as a pin bar, a doji, an outside or even just an engulfing candle with a higher close. You can exploit these levels or zones by watching the price action that occurs at the given levels.
There is nothing of high importance scheduled today concerning either the Australian Dollar or the US Dollar.
Ready to trade our free Forex signals? Here is our list of the best Forex brokers worth checking out.