
Bullish view
Buy the BTC/USD pair and set a take-profit at 65,000.
Add a stop-loss at 58,000.
Timeline: 1-2 days.
Bearish view
Sell the BTC/USD pair and set a take-profit at 58,000.
Add a stop-loss at 65,000.
The BTC/USD pair remained slightly above the crucial support level of 60,000 as investors embraced a risk-on sentiment. Bitcoin price rose from the year-to-date low of 58,000 to 60,392.
Bitcoin Price Steady as Key Challenges Remain
The BTC/USD pair wavered as investors embraced a risk-on sentiment in the market as odds of Federal Reserve interest rate hikes fell. As a result, the US Dollar Index (DXY) retreated for the fourth consecutive days, reaching its lowest level since June 23rd.
US stocks also continued rising, with the Dow Jones and Nasdaq 100 indices soaring by 292 and 522 points, respectively. This rally happened amid the ongoing technology boom.
Top Regulated Brokers
Still, Bitcoin faces some major risks ahead. For one, spot Bitcoin ETFs have shed over $4 billion this month, the worst performance since they were launched in 2024. These funds have now had a cumulative inflow of $51.6 billion. They now hold over $72.8 billion in assets.
There are also signs that Michael Saylor’s Strategy will start selling Bitcoin. In a statement on Monday, he said that the company may decide to sell coins worth over $1 billion. It will do that to boost its cash reserves as its preferred stocks continued falling. As a result, the STRC stock jumped to $83.67 from the year-to-date low of $71.2.
Selling Bitcoin would be risky as Strategy has been the most aggressive Bitcoin buyers in the past few years. It now holds 847,363 coins valued at over $51.1 billion. If this happens, it will put more pressure on Bitcoin as we saw last year. BTC dropped below $60,000 after the company sold 32 coins.
BTC/USD Technical Analysis
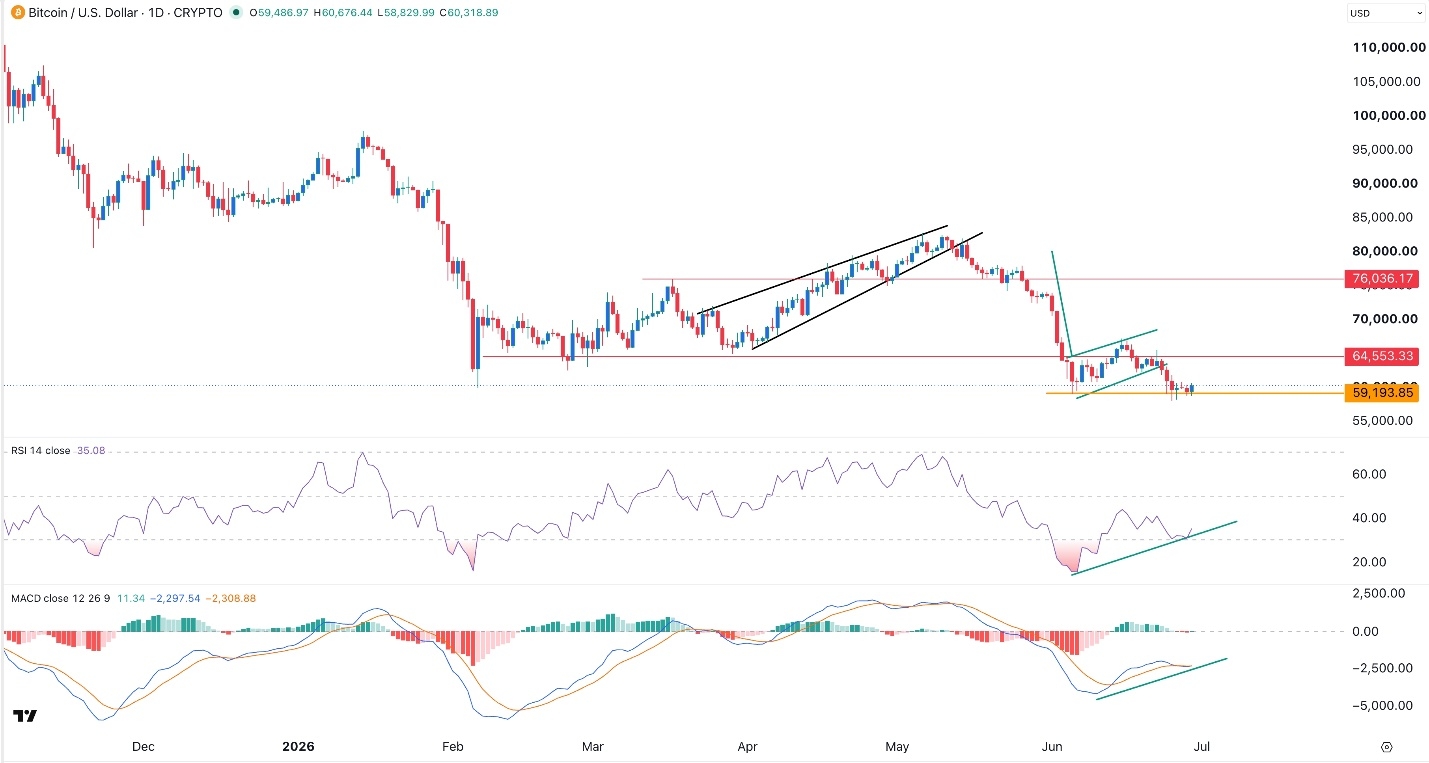
Bitcoin price has stabilized at a crucial support level this week. It was trading at 59,000, where it has formed a double-bottom pattern whose neckline was at 66,925. A double-bottom is one of the most common bullish reversal signs in technical analysis.
The pair has formed a bullish divergence pattern as the Relative Strength Index (RSI) has formed an ascending channel. Also, the MACD indicator has formed a bullish crossover and is pointing upwards.
Therefore, the pair will likely rebound, potentially to the key resistance at 65,000. A move below the support of 58,000 will invalidate the bullish outlook.
Ready to trade our free Forex signals? Here are the best MT4 crypto brokers to choose from.