
Ripple is trading around $1.38 at the time of writing, the token now faces a possible 45% slide to $0.78. However, persistent ETF inflows, highlighting institutional interest, could curb the downtrend.
Geopolitical and Inflation Risks Suggest Downside for Ripple
Escalating US-Iran tensions continue to unsettle global markets. US President Donald Trump has issued fresh threats, saying that “the clock is ticking” for Iran, warning of “bad things” that would happen if Tehran delayed the agreement to a peace deal, while also threatening renewed military action if negotiations collapse
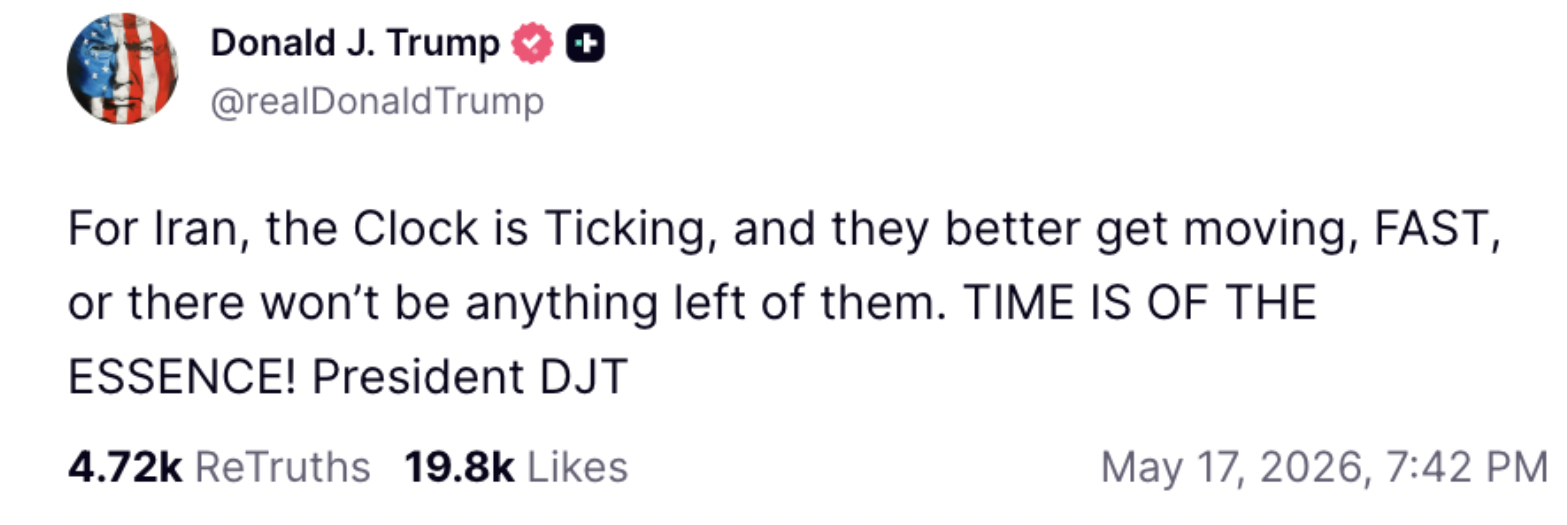
Source: TruthSocial/Donald J. Trump
These developments have prolonged uncertainty around the Strait of Hormuz, a vital chokepoint for global oil shipments.
Oil prices have surged in response. Brent crude has climbed above $110 per barrel, while WTI climbed as high as $105 per barrel after Trump’s statement on Sunday amid supply disruption fears.
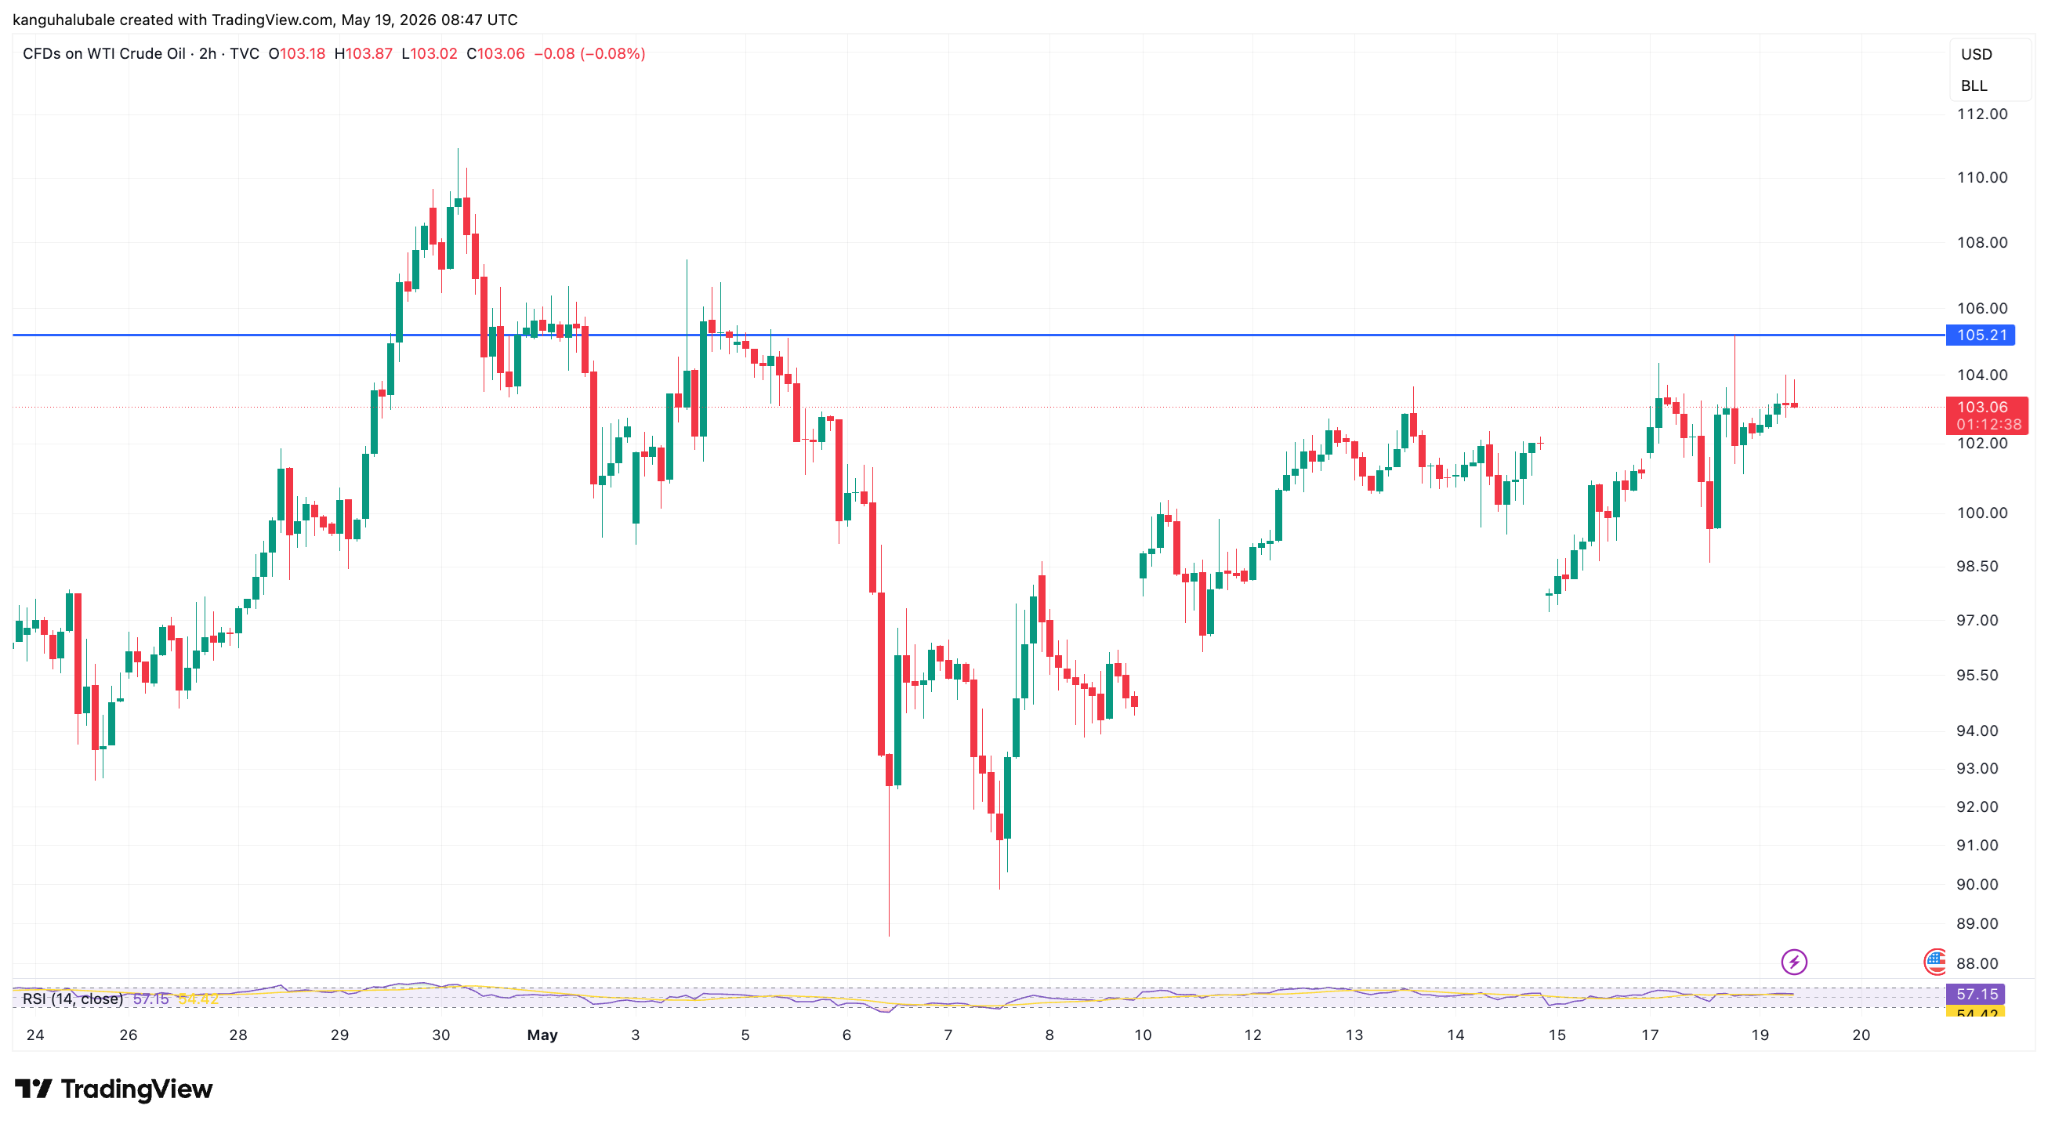
CFDs on WTI crude oil one-hour chart. Source: Cointelegraph/TradingView
This energy shock is feeding directly into higher expectations of inflation. Transportation, manufacturing, and consumer goods costs are rising, reversing earlier disinflationary trends. US inflation readings have edged higher, with some measures approaching or exceeding 3% amid the conflict's persistence.
Higher inflation complicates the Federal Reserve's policy path. With energy costs adding upward pressure, officials have held the benchmark rate steady in the 3.5–3.75% range and raised their inflation forecasts.
Markets now price in fewer rate cuts for 2026, or even the possibility of hikes if pressures intensify, with traders now pricing in possible hikes early in 2027 if the oil shock persists.
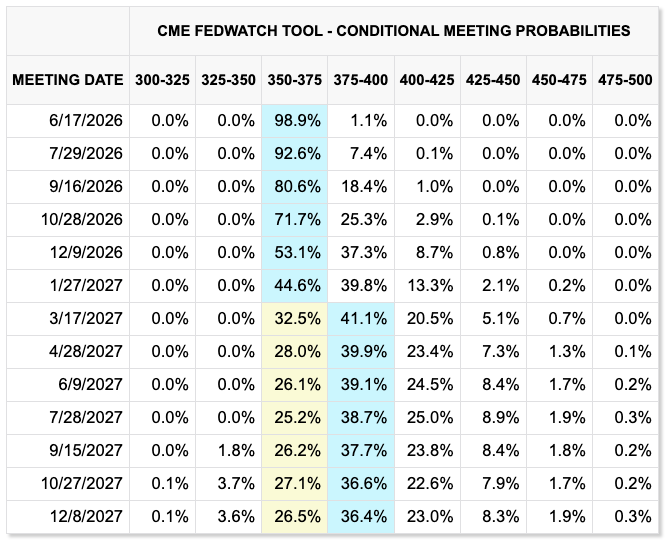
Federal Reserve target rate probabilities (screenshot). Source: CME Group FedWatch Tool
This risk-off environment typically weighs on risk assets like cryptocurrencies, as higher borrowing costs and tighter liquidity reduce appetite for speculative holdings.
Higher-for-longer rates are toxic for risk assets like XRP. Crypto thrives on cheap liquidity and growth optimism. As such, rising inflation and hawkish policies tighten financial conditions, reduce investor appetite for speculative holdings, and push capital toward safer yields.
XRP, already sensitive to macro flows, has weakened alongside broader risk-off sentiment. Without rate relief, institutional and retail buyers stay sidelined, amplifying downside momentum for XRP price.
Top Regulated Brokers
XRP Bear Flag Breakdown Underway
The XRP/USD pair has validated a classic bear pennant pattern on the two-day chart, setting the stage for a massive move downward.
The pattern formed after an initial sharp pole decline from January highs near $2 to lows around $1.12 on Feb. 6, representing a 43% drop in price. The subsequent consolidation created the pennant: a small symmetrical triangle defined by lower highs and higher lows that trapped buyers in a false recovery, as shown in the chart below.
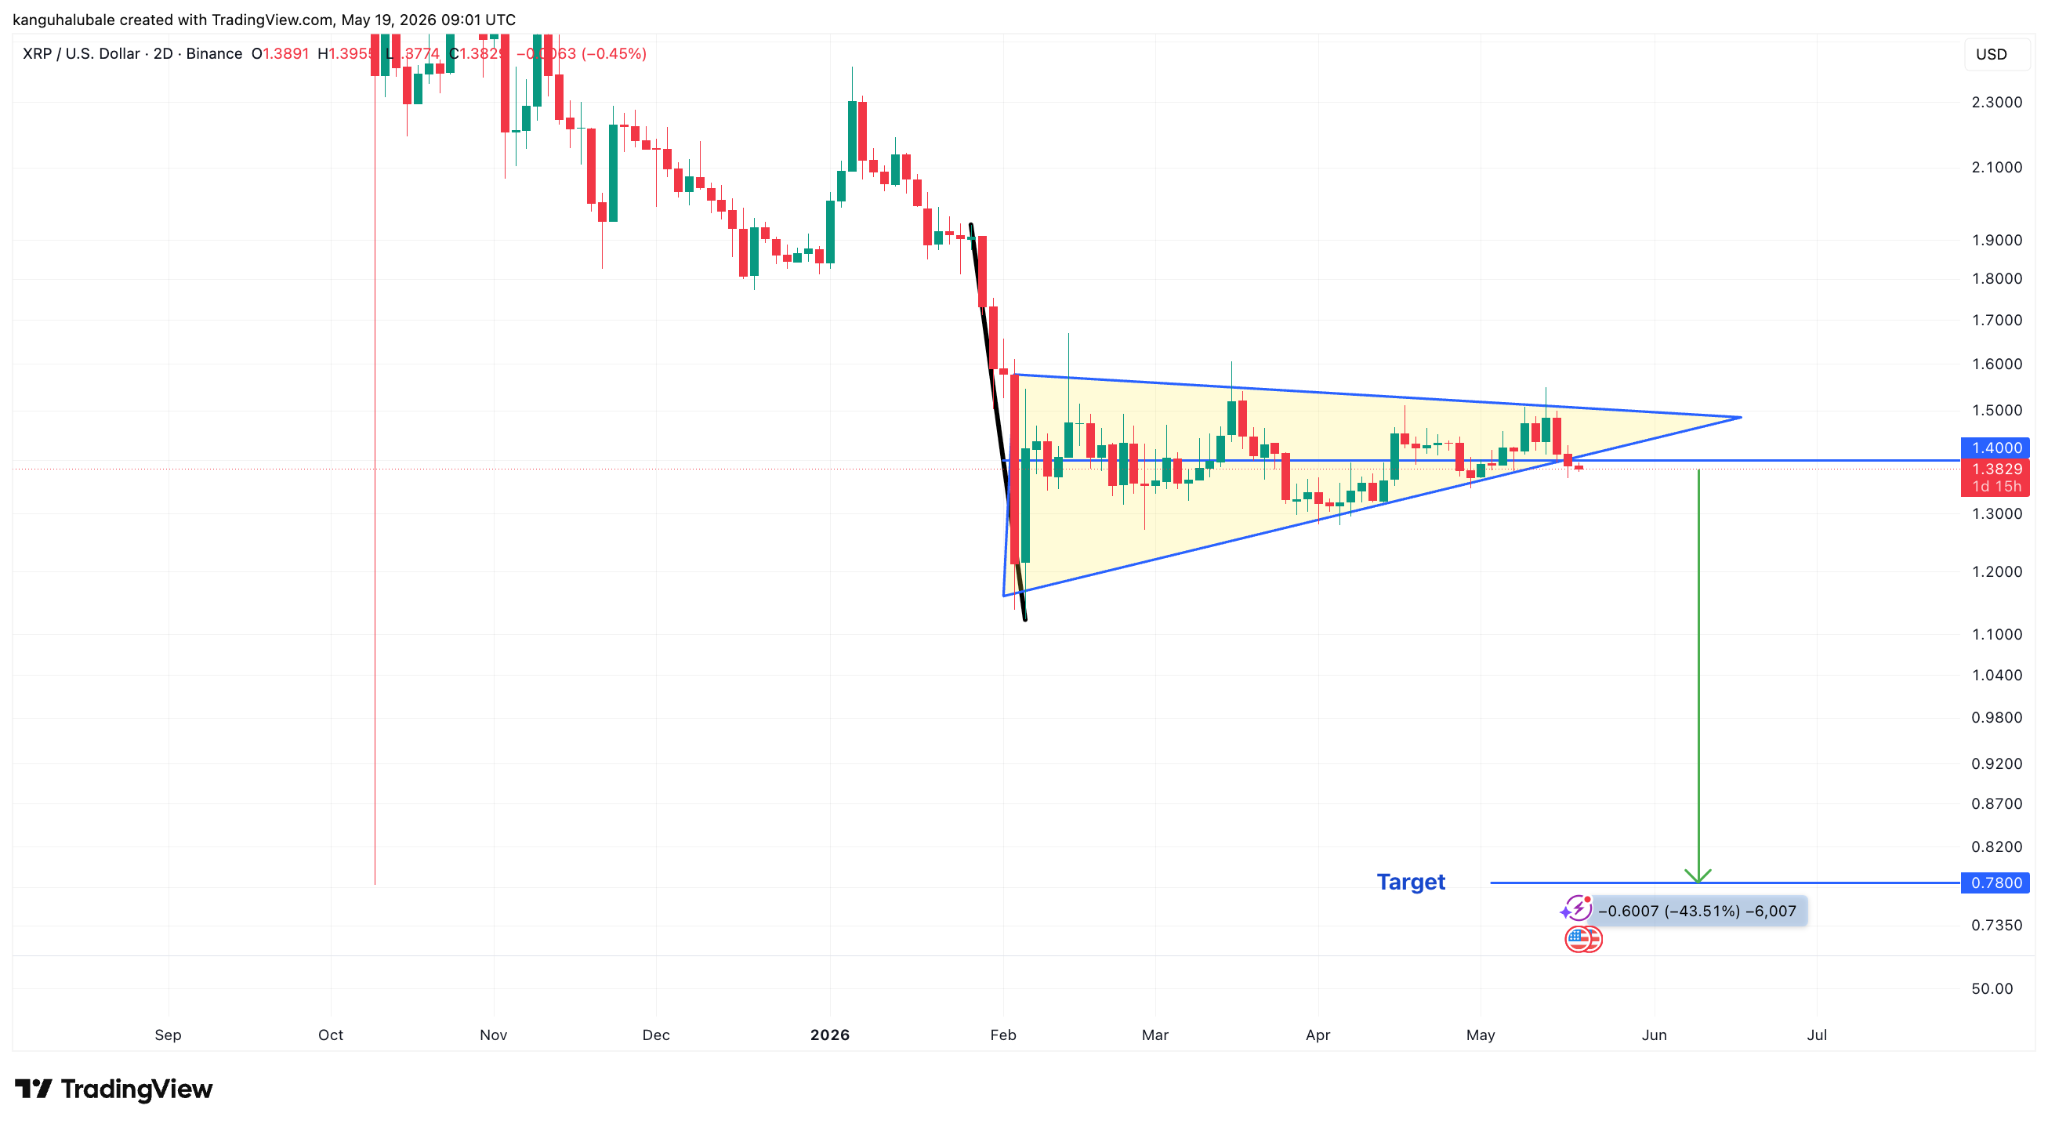
XRP/USD two-day chart. Source: TradingView
Breakdown below the pennant’s lower trend line near $1.40 has now occurred, confirming continuation of the downtrend.
In technical analysis, the bear pennant’s measured move projects a decline equal to the pole’s length from the breakdown point. Applied here, that calculation points precisely to the $0.78 zone, representing the full 43.5% drop from current levels.
Recent price action—bouncing modestly to $1.55 was a classic bear trap, fitting the flag’s bearish resolution. A decisive close below $1.30 would accelerate the move, with $1.20 acting as intermediate support before the final leg below $0.80.
XRP ETF Demand Makes a Comeback
Despite bearish technical signals, institutional demand for XRP investment products has improved notably in the last two weeks, providing a potential catalyst for price stabilization.
US-based spot XRP exchange-traded funds (ETFs) posted $750,000 in net inflows on Monday. This marked nine consecutive days of net inflows, totaling $95,5 million. This streak has pushed cumulative inflows to nearly $1.4 billion and AUM to $1.14 billion.
This reflects renewed investor appetite from traditional finance participants seeking exposure to the asset. The sustained inflow streak signals improving institutional confidence even as short-term price action remains fragile.
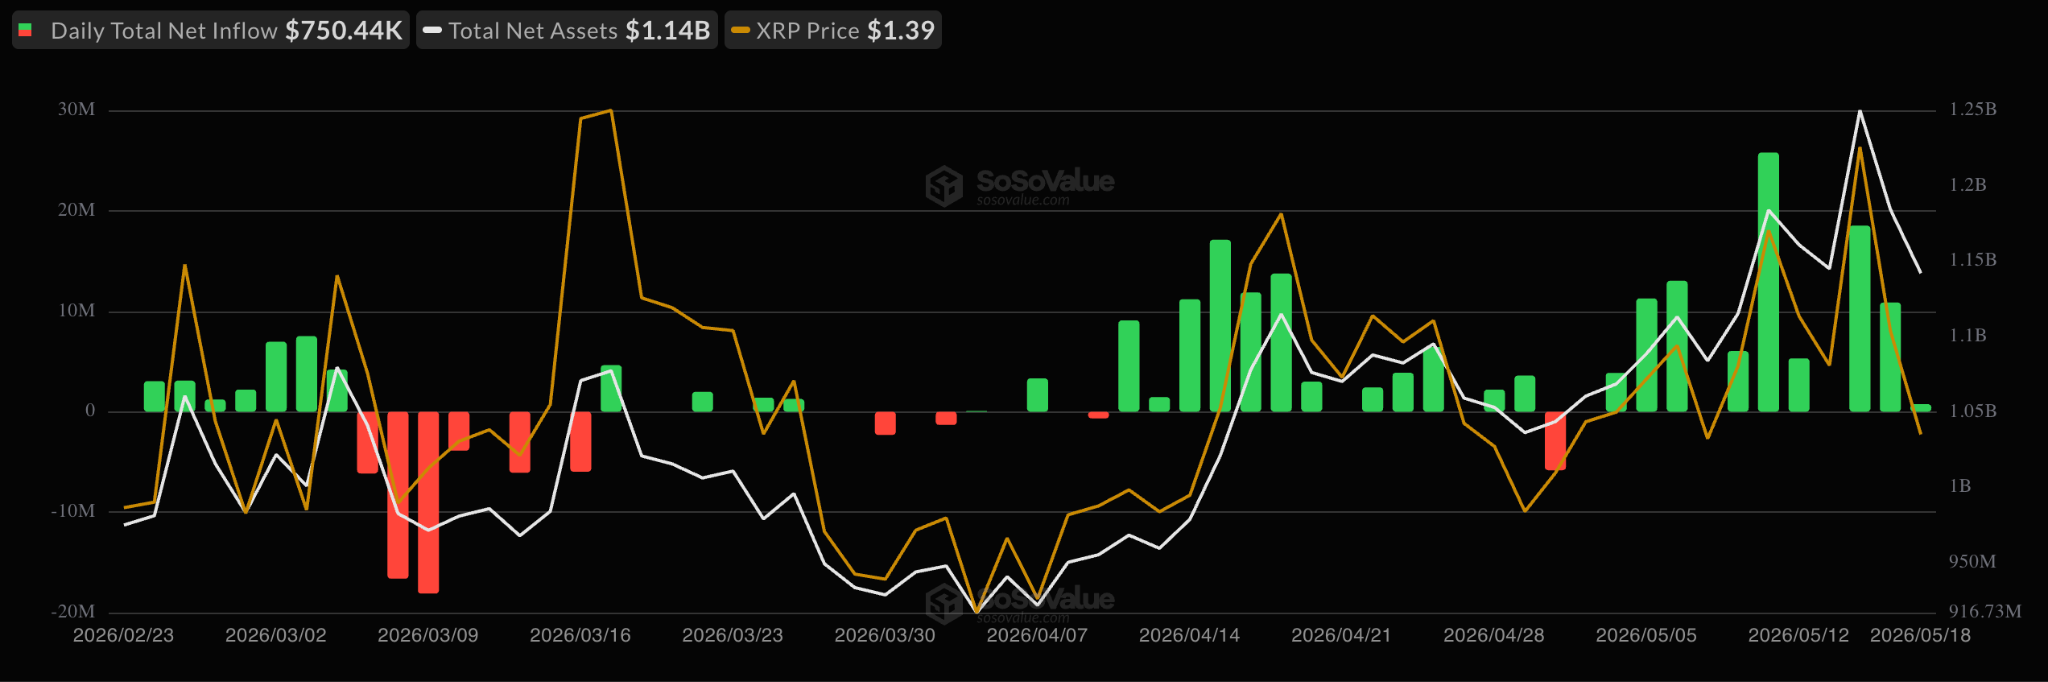
US Spot XRP ETF flows chart. Source: SoSoValue
CoinShares data also shows that global XRP investment products registered weekly inflows of approximately $67.6 million during the week ending May 15, outperforming Bitcoin (BTC) and Ether (ETH) which saw $981.5 million and $250 million in outflows, respectively.
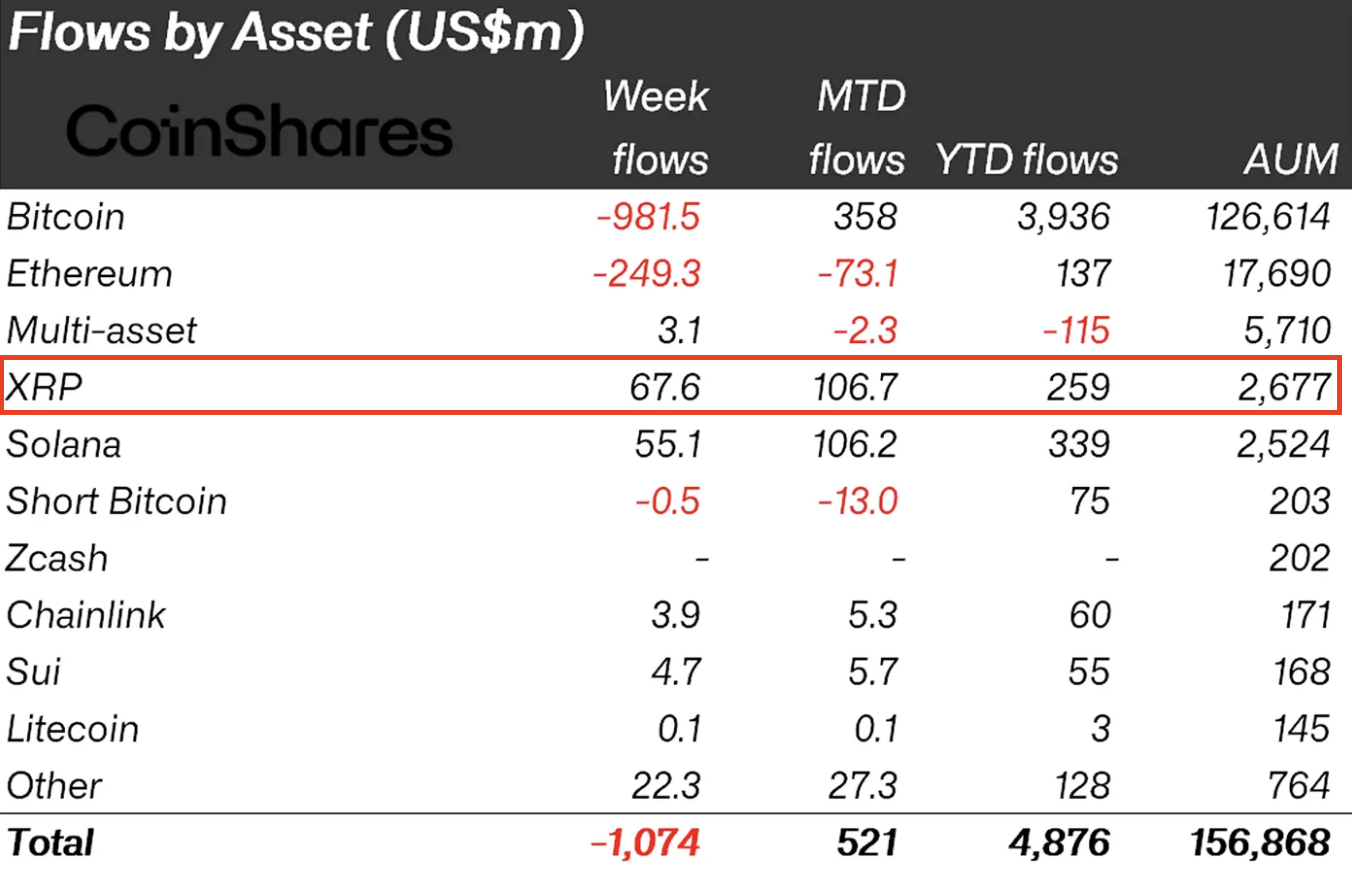
Global Crypto ETP flows table. Source: CoinShares
ETF inflows reduce circulating supply while signaling broader adoption among professional investors. Persistent accumulation from asset managers can help offset selling pressure from retail traders and leveraged speculators.
Analysts say the renewed ETF demand may reflect growing optimism surrounding regulatory clarity in the United States and increasing use of XRP-related payment infrastructure across global financial markets.
If macroeconomic conditions stabilize and geopolitical risks ease, the improving institutional flow picture could support a stronger recovery in XRP price later this year.
We hope you enjoyed reading our analysis of Ripple. If you’d like to trade with one of the best crypto CFD brokers, check out our list.