


This currency pair has advanced, with risky assets broadly higher, and that includes the British Pound. However, the move higher that we are seeing looks somewhat fragile and it is not clear what is driving it beyond a general increase in risk sentiment which has been triggered by President Trump’s pronouncement last weekend to the effect that a verbal deal has been broadly agreed between the USA and Iran to end the war.
The US Dollar has weakened somewhat on the improved risk sentiment, but as it becomes clearer that significant obstacles remain towards the conclusion of this deal, we see firmer bearish retracement. Will the deal come to fruition, or collapse?
Top Regulated Brokers
US Dollar Most Affected by Geopolitical Developments
President Trump’s announcement raised expectations that an end game to the war is finally here. He was very bullish over the weekend about the prospect of a deal, presenting it as all but agreed, and effectively stating that it had been agreed verbally. If a deal is successfully concluded that ends the war, removes fear, and provides security for the region and a fully open Strait of Hormuz, it can be expected that risk sentiment will rise, and other themes will dominate the market. It will also lower expectations of oil price shock inflation, although we already see the price of Crude Oil markedly lower so that is already happening, which is also helping to boost risk sentiment.
While the British Pound tends to get a boost on improving risk-on sentiment, the US Dollar is more affected. A successfully concluded deal will likely see a notably weaker US Dollar and that will raise bullish prospects for this pair. That is why the prospect of a deal should make traders sit up and take notice here.
GBP/USD Technical Analysis
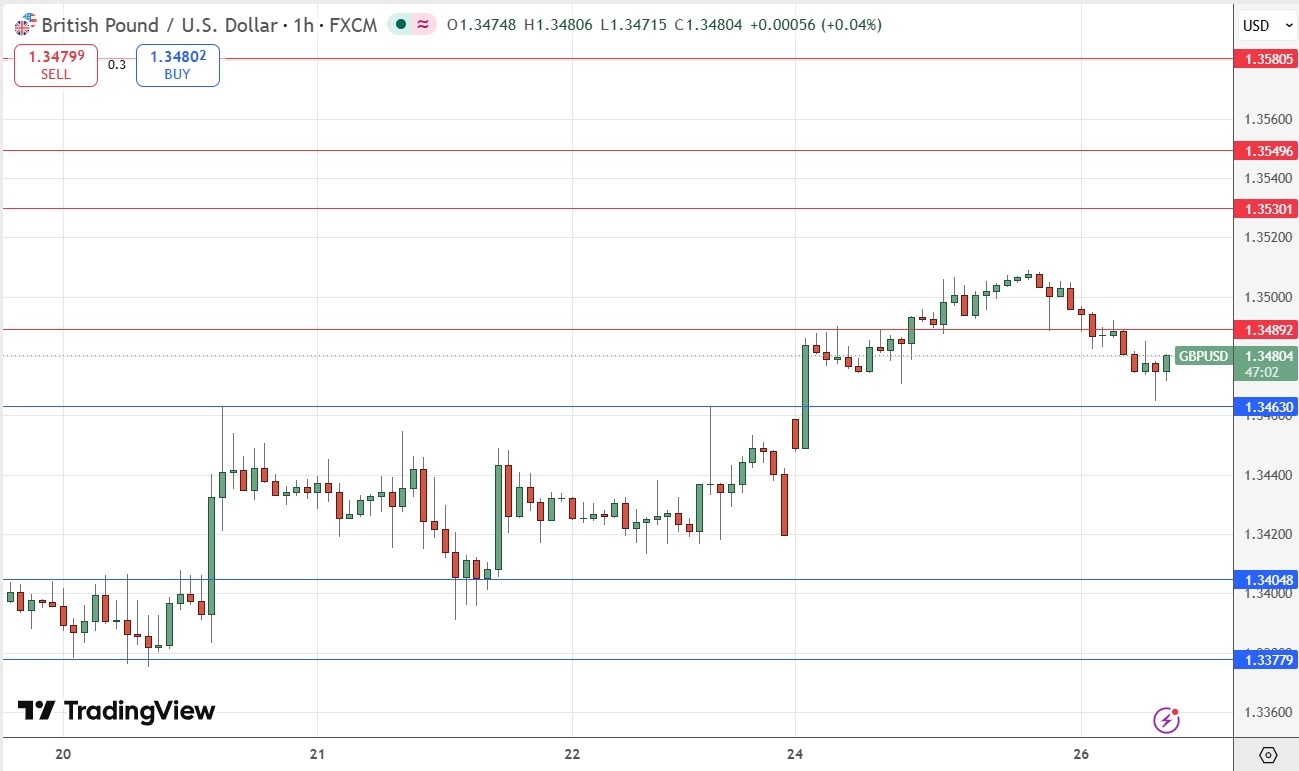
The price action is clearly reflecting the perceived likelihood of an Iran deal: when it looks more likely, the price rises; less likely, the price falls. This is why the price initially rose yesterday before falling back during the day as it became clearer that this is not as much of a done deal as President Trump was initially implying.
As the price rose yesterday on the news, it managed to get established above what looked like key resistance at $1.3500, before falling back. Looking at the current price action, the support below at $1.3463 looks like it could be strong, but it has not quite been tested yet.
The resistance at $1.3489 looks more questionably, I do not have much faith in this level although it is present technically.
The lower support at $1.3404 looks like the strongest nearby level on the price chart as it has been tested many times and is confluent with the round number at $1.3400.
Overall, the chart looks weakly bullish, but would become less so if the price gets established below $1.3463 later today.
Watch Out for a Sudden Disintegration of Deal Prospects
When a major geopolitical deal approaches conclusion, the risk of it decisively falling apart rises. I don’t think that the market is expecting this at all, as the current situation of working towards a deal has been going on for almost two months now, and people have got used to it. One day a deal is closer, the next it is further away, and the market see-saws. Yet risk factors remain. It may be that the Iranian regime has no intention of concluding a deal on any terms, and they are just spinning the process out to weaken Trump politically and buy time – the war is not popular in the USA and is becoming less so.
Another element on the horizon is Israeli impatience with the existing “ceasefire” in Lebanon, as it is taking casualties and hits inside Israel as well as inside Lebanon from small wire-guided drones shot by Hezbollah. There are strong signs that Israel is moving towards a dramatic escalation in Lebanon, while Iran is insisting that this will derail the deal if it happens. The USA is backing Israel on this, seemingly, but it may be brinkmanship.
Do Markets Have It All Priced In Already?
I could be wrong that progress towards an Iran deal is going to be the major factor in where the price goes next. Markets may be better than I expect as seeing past the mechanics of the situation and instead seeing a reality in which neither side in this war can really take things any further towards their advantage. It is possible that this situation runs on for months, not quite peace, or not quite war, but risk appetite persists even if it isn’t particularly strong.
It might make more sense to see the drop in crude oil prices as something that isn’t going to change rather than something that is at strong risk of reversing. That would point towards a more solid bullish outlook for this currency pair.
My Take on GBP/USD
Most technical analysts will look at the price chart and see a weakly bullish situation where a long trade from either $1.3463 or $1.3404 would look like the most attractive potential set up. Alternatively, a bullish breakout above $1.3500 could be a trigger that traders are looking to. Yet, there seems to be neither a strong trend nor a strong range here, so we need more evidence from price behaviour to come to any firmer conclusions, which will likely come from the price touching some of these levels.
Review, Support & Resistance Levels
My previous GBP/USD signal on 21st May was not triggered.
Risk 0.75%.
Trades may only be entered prior to 5pm London time today.
Long Trade Ideas
Long entry following a bullish price action reversal on the H1 timeframe immediately upon the next touch of $1.3463, $1.3413, or $1.3378.
Put the stop loss 1 pip below the local swing low.
Adjust the stop loss to break even once the trade is 25 pips in profit.
Take off 50% of the position as profit when the price reaches 25 pips in profit and leave the remainder of the position to run.
Short Trade Ideas
Short entry following a bearish price action reversal on the H1 timeframe immediately upon the next touch of $1.3489, $1.3530, or $1.3550.
Put the stop loss 1 pip above the local swing high.
Adjust the stop loss to break even once the trade is 25 pips in profit.
Take off 50% of the position as profit when the price reaches 25 pips in profit and leave the remainder of the position to ride.
The best method to identify a classic “price action reversal” is for an hourly candle to close, such as a pin bar, a doji, an outside or even just an engulfing candle with a higher close. You can exploit these levels or zones by watching the price action that occurs at the given levels.
There is nothing of high importance scheduled today concerning either the British Pound or the US Dollar.
Ready to trade our daily Forex signals? Here is our list of the best Forex brokers worth checking out.