
Top Regulated Brokers
The GBP/USD currency pair continues to trade within a range, which is notably flat and directionless. Looking at the price chart, it is challenging to see any trend. The price looks like it is consolidating or at best moving in choppy swings which have no clear logic. This currency pair usually moves quickly and easily into new price spaces, so it can be very dangerous to trade when it is exhibiting this kind of price behaviour.
When a range looks so strong and directionless, it is more likely to hold. When a range holds, it can give opportunities for range trades: reversals off the extremes of the range, represented by support and resistance levels.
Despite this clear range, the US Dollar has strengthened in recent hours, getting a boost from higher-than-expected CPI (inflation) data yesterday. If the British Pound were relatively weaker, this would be more significant, but it still suggests that any surprise breakout from this range is probably more likely on the downside.
With the US Dollar looking potentially stronger, this solidifies the anticipation of a test of what you might call the range extreme at the low, confluent with both a horizontal support level at $1.3498 and a very important round number at $1.3500. Looking at the price chart below, we can see that this level is an extreme and has not been tested for a while. An absence of tests for a time suggests a level is more likely to hold when next touched, which could generate powerful profits on the long side.
It is this potential to reach $1.3500 today which is attracting the interest of more traders.
GBP/USD Technical Analysis
A technical analysis of this currency pair shows very little except a range from about $1.3500 to $1.3650, which is not especially large for this currency pair. There is no long-term trend or any sign of direction. Technically, everything points towards the price looking likely to test $1.3500 which is the bottom of the range and therefore, in this condition, likely to hold.
The short-term price action is bearish, so I am comfortable to expect this test of $1.3500, and I am also quite comfortable to expect that area will likely hold.
One factor which arguably suggests a more bearish outlook is the recent breakdown below $1.3550, which has now held as resistance after twice being tested from below following the breakdown. This could indicate that the price is likely to trade lower. Yet despite that, the support at about $1.3500 looks strong for the reasons I have already outlined.
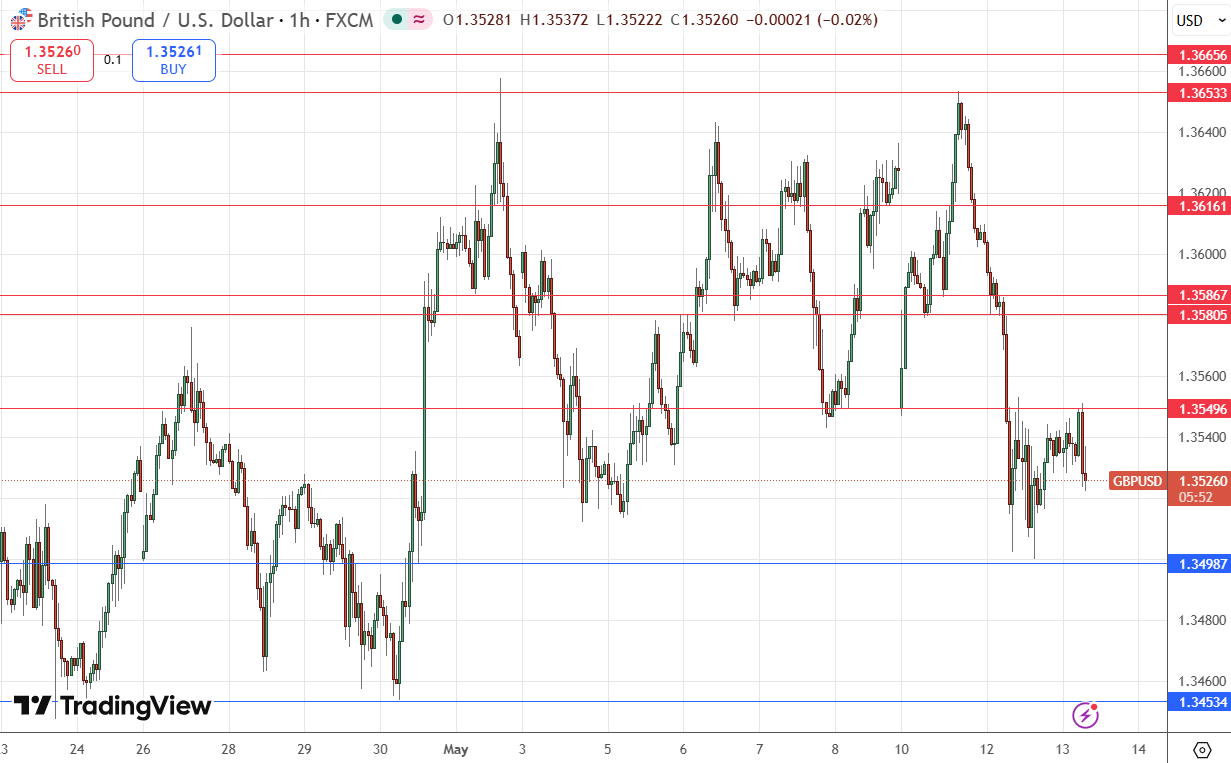
(image13052026gbpusd)
Watch Out for Sudden USD Weakness
We have seen the US Dollar get a little bump higher upon bigger than expected US CPI data, increasing pressure on the Fed to take a more hawkish bias and underscoring the continuing problem of above-target inflation.
Today will bring a release of US PPI (purchasing power index) data which is an inflation indicator. The data is expected to show a month-on-month increase of 0.5% when it is released today. If the actual number is notably lower, say an increase of 0.3% or below that, then the price could be sent quickly higher on a more dovish outlook for US inflation. When these data-driven moves happen in Forex, technical levels such as support and resistance are often completely ignored by the resulting price action.
Could a Short Trade Set Up?
It is usually best in Forex not to take too strong a directional bias most of the time. Although I see the best potential opportunity which will be likely to set up today as a long trade from a bounce at $1.3500, don’t ignore the potential for either a bearish breakdown below $1.3500, although I see this as unlikely.
What could be a better short trade opportunity, and much less risky, would be a short trade from another failed test of the nearest resistance level at $1.3550. This is a well-established resistance level which is also completely confluent with a half-number. A short trade from another failure to break that would be completely within the short-term trend and the logic of the price action here too.
My Take on GBP/USD
The thing to watch here today is likely going to be how the price reacts when it reaches $1.3500. This will probably be today’s pivotal point. If it gets established below $1.3500, I will be very careful about going short; if it travels higher in the near term to $1.3550 and falters convincingly there, a short trade will look like an excellent option.
As the price chart is a bit of a mess, we can expect some twists and turns in the price movement by the time of my next analysis. I have no strong conviction on this currency pair.
Review, Support & Resistance Levels
My previous GBP/USD signal on 11th May was not triggered.
Risk 0.75%.
Trades must be taken before 5pm London time today.
Long Trade Ideas
Long entry following a bullish price action reversal on the H1 timeframe immediately upon the next touch of $1.3500, $1.3453, or $1.3410.
Place the stop loss 1 pip below the local swing low.
Move the stop loss to break even once the trade is 25 pips in profit.
Remove 50% of the position as profit when the price reaches 25 pips in profit and leave the remainder of the position to ride.
Short Trade Ideas
Go short following a bearish price action reversal on the H1 timeframe immediately upon the next touch of $1.3550, $1.3581, or $1.3587.
Place the stop loss 1 pip above the local swing high.
Move the stop loss to break even once the trade is 25 pips in profit.
Remove 50% of the position as profit when the price reaches 25 pips in profit and leave the remainder of the position to ride.
The best method to identify a classic “price action reversal” is for an hourly candle to close, such as a pin bar, a doji, an outside or even just an engulfing candle with a higher close. You can exploit these levels or zones by watching the price action that occurs at the given levels.
There is nothing of high importance scheduled today concerning the British Pound. Regarding the US Dollar, there will be a release of PPI data at 1:30pm London time.
Ready to trade our free Forex signals? Here is our list of the best Forex brokers worth reviewing.