
Top Regulated Brokers
After trading below its realized price for an extended period, ETH recently surged above $2,300, pushing the average holder back into profit.
This psychological milestone coincides with a constructive technical setup: a bull flag pattern on the daily chart that projects ETH price rally to areas above $3,000.
ETH Trades Above Realized Price
Data from CoinMarketCap and TradingView shows that ETH price rose 42% to $2,400 last week from its multi-year low of $1,750 reached on Feb. 6, fueled by selling whales and reducing institutional demand.
This rally has seen ETH rise above its realized price (the average cost basis of all moved ETH, currently at $2,320, according to data from Glassnode).
The average ETH holder returning to profit after unrealized losses provides meaningful financial relief for many holders, signaling a bullish outlook.
Historically, breaking above this level shifts market sentiment from fear to greed, reducing sell pressure from underwater holders and encouraging HODLing. This often fuels bullish momentum, attracting new buyers and short squeezes.
The chart below shows that when the price reclaimed its active realized price after briefly dipping below it in May 2022, it went on to rally 2,200% to $4,400 from $190.

More recently, when the price reclaimed its realized price in May 2025 after trading below it for a period of two months, it went on to rally 173% to its $4,950 all-time high from $1,800. The gains were 58% after ETH/USD reclaimed its cost basis in early 2023.
This implies that holding above $2,300 is crucial to ensure a potential retest at $3,000.
Ethereum Demand Returns
A critical driver behind ETH’s recent strength is the evident return of demand, particularly from institutional players.
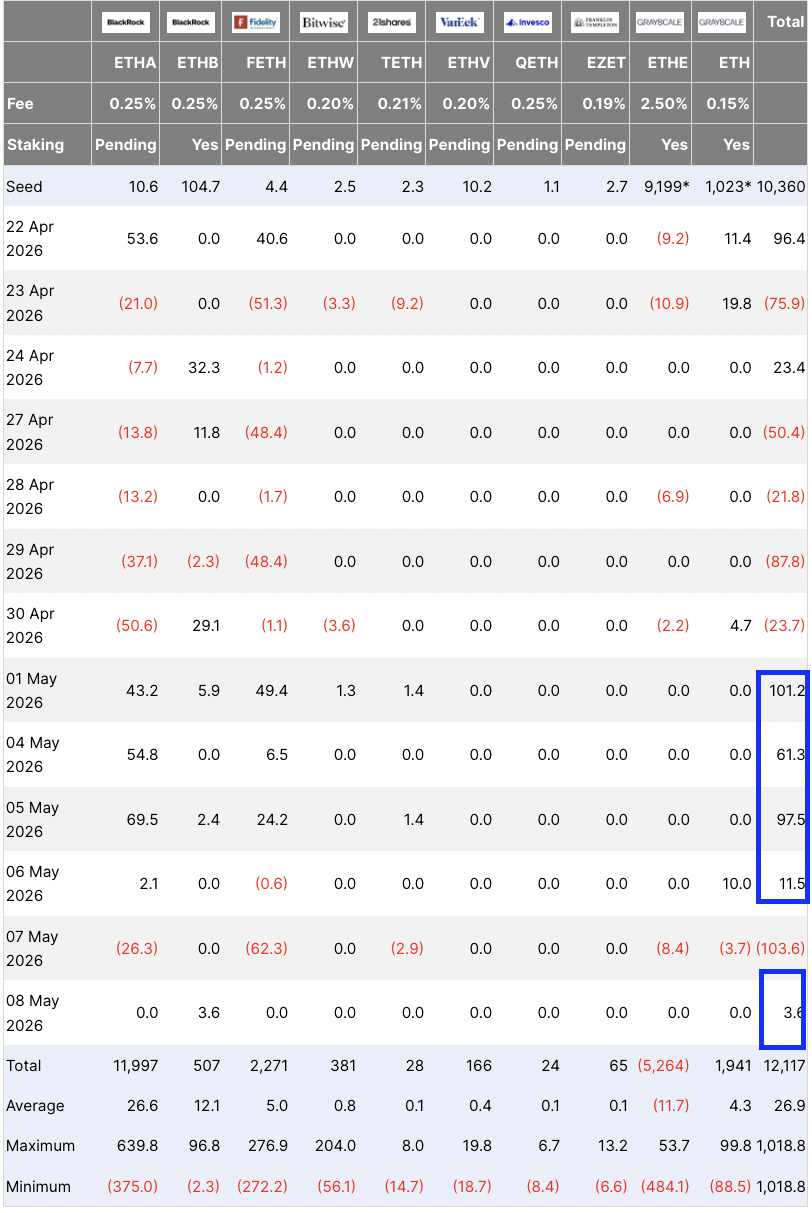
Spot Ethereum ETFs have recorded consistent net inflows in recent weeks, signaling renewed capital allocation from traditional finance. Data from UK-based crypto investment firm Farside Investors shows multi-day streaks of positive flows, with major issuers like BlackRock contributing significantly—sometimes tens of millions in a single session.
Last week, these investment products recorded four consecutive days of inflows, totaling $271.5 million.
This has pushed cumulative inflows to $12.5 billion and the total assets under management to $13.73 billion, reflecting growing mainstream acceptance.
This institutional interest extends beyond ETFs. Publicly traded firms are actively accumulating ETH on their balance sheets. BitMine Immersion Technologies stands out as a prominent example, having executed multiple large weekly purchases throughout 2026.
In one recent week alone, the company acquired over 101,000 ETH worth approximately $240 million, bringing its total holdings above 5.18 million ETH—representing a substantial portion of circulating supply. BitMine’s aggressive strategy, targeting up to 5% of total ETH, underscores corporate confidence in Ethereum’s long-term value proposition as a utility asset and store of value.

Derivatives market data further corroborates the demand resurgence. Ethereum’s net taker volume has flipped to positive, reaching levels not seen in years.
Positive readings indicate aggressive buyers are dominating market orders, outpacing sellers. This shift, with buy-side imbalances exceeding $100 million on some days, points to genuine conviction rather than mere short covering.
The 30-day average calculation of taker buy volume has remained elevated, echoing aggressive buyer behavior observed in prior recovery phases.

These metrics collectively paint a picture of returning liquidity and absorption capacity. Reduced selling pressure from long-term holders (now in profit), combined with fresh institutional bids creates a more constructive supply-demand dynamic.
Ether’s Bull Flag Targets $3,000
The daily chart reveals a classic bull flag consolidation following an initial impulsive rally. This pattern typically forms following a sharp uptrend, with parallel trendlines containing price action before a breakout.
A decisive daily close above the flag’s upper boundary near $2,400 would validate the setup and open the path to the measured target of the prevailing chart pattern at $3,020, roughly 30% higher than the current level.
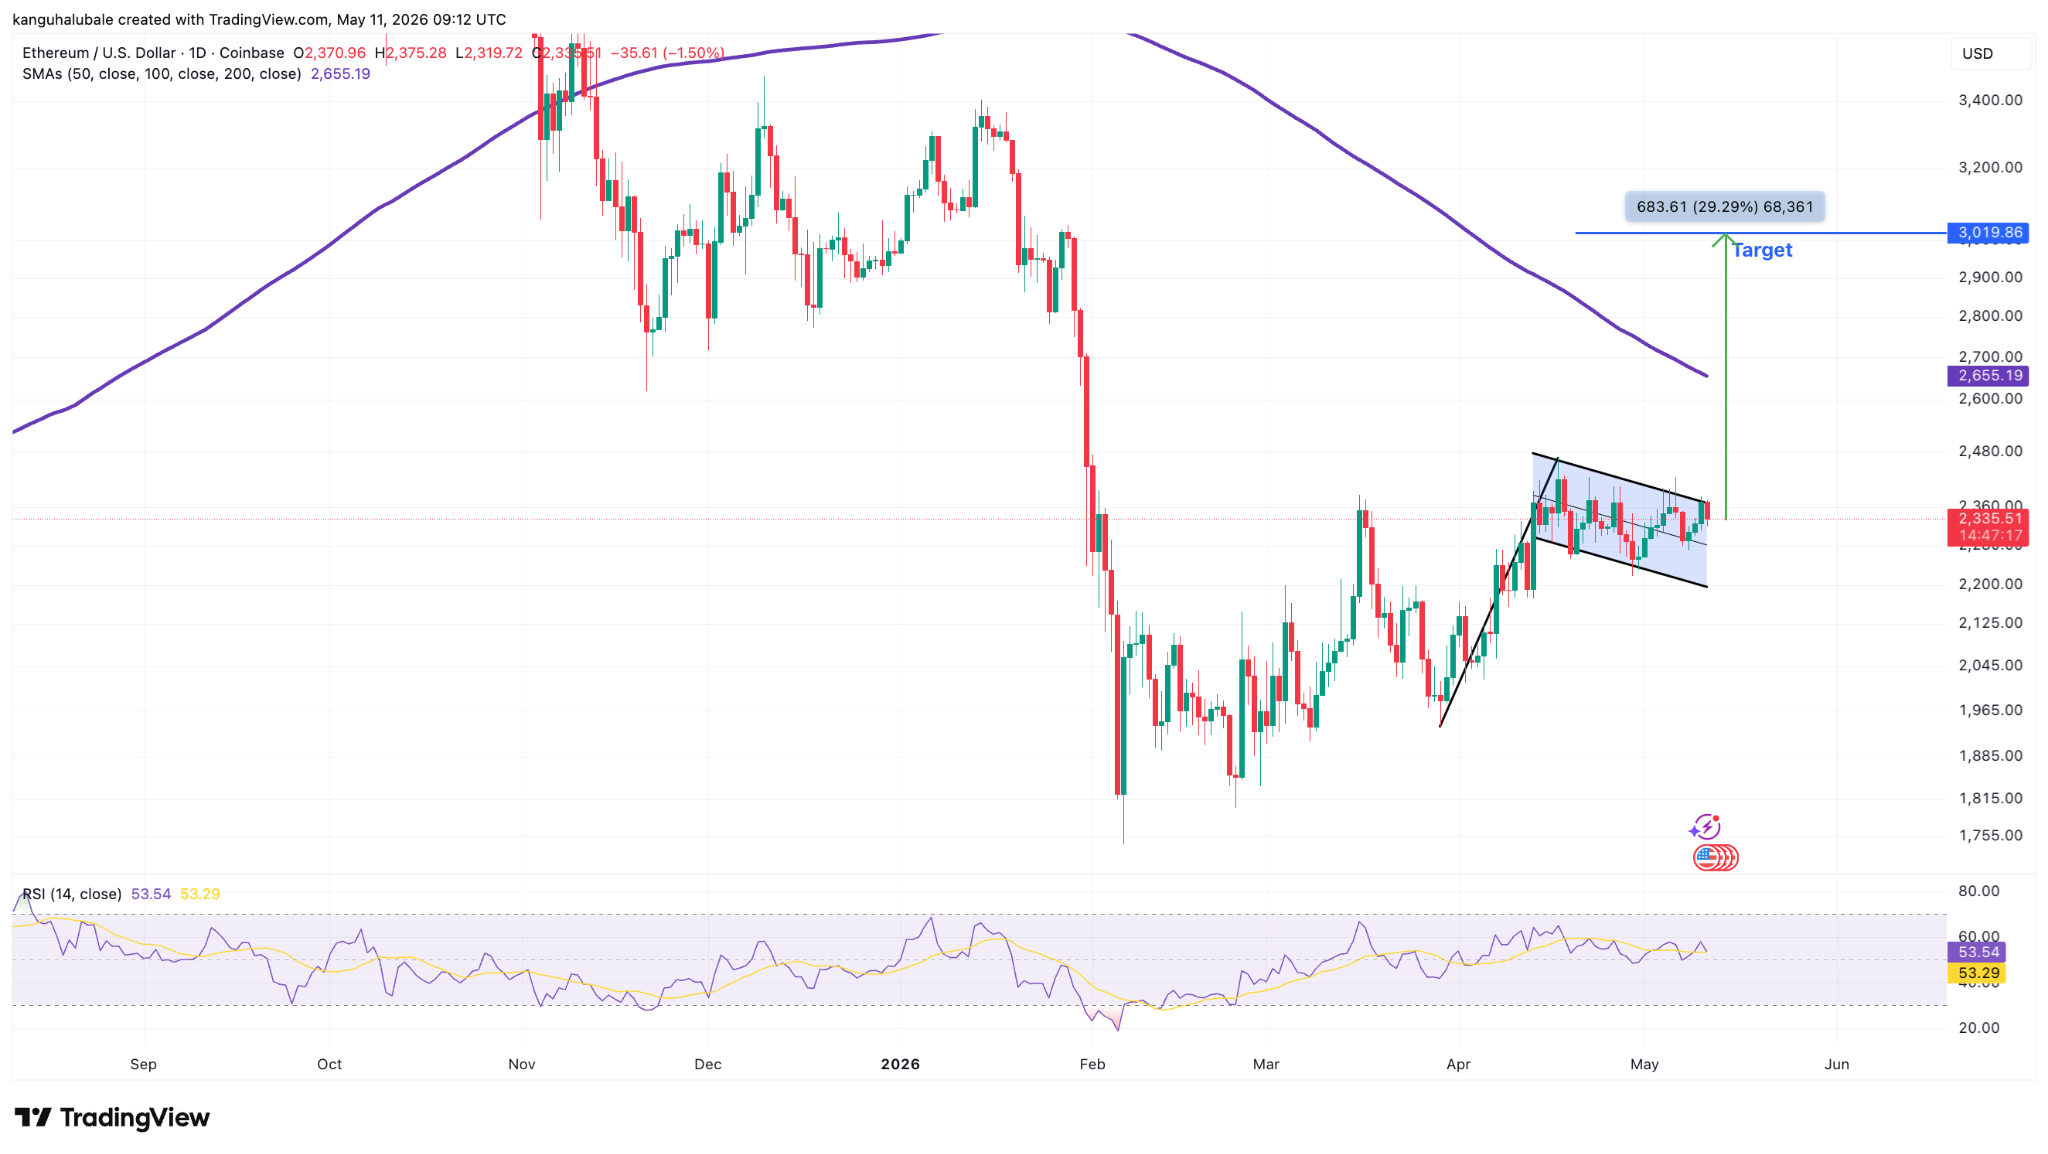
ETH/USD daily chart. Source: TradingView
However, market participants remain cautious of near-term hurdles. Failure to hold above $2,300 could see a retest of the lower support line of the flag at $2,200, but the overall structure favors continuation higher if macroeconomic conditions and risk appetite remain supportive.
We hope you enjoyed reading our analysis of Ethereum. If you’d like to trade with one of the best crypto CFD brokers, check out our list.