
My previous BTC/USD signal on 30th April was not triggered.
Today’s BTC/USD Signals
Risk 0.50% per trade.
Trades may only be entered before 5pm Tokyo time Tuesday.
Long Trade Ideas
Long entry after a bullish price action reversal on the H1 timeframe following the next touch of $79,440, $77,858, or $77,157.
Put the stop loss $100 below the local swing low.
Adjust the stop loss to break even once the trade is $100 in profit by price.
Remove 50% of the position as profit when the trade is $100 in profit by price and leave the remainder of the position to run.
Short Trade Ideas
Short entry after a bullish price action reversal on the H1 timeframe following the next touch of $80,469 or $81,203
Put the stop loss $100 above the local swing high.
Move the stop loss to break even once the trade is $100 in profit by price.
Remove 50% of the position as profit when the trade is $100 in profit by price and leave the remainder of the position to run.
The best method to identify a classic “price action reversal” is for an hourly candle to close, such as a pin bar, a doji, an outside or even just an engulfing candle with a higher close. You can exploit these levels or zones by watching the price action that occurs at the given levels.
BTC/USD Analysis
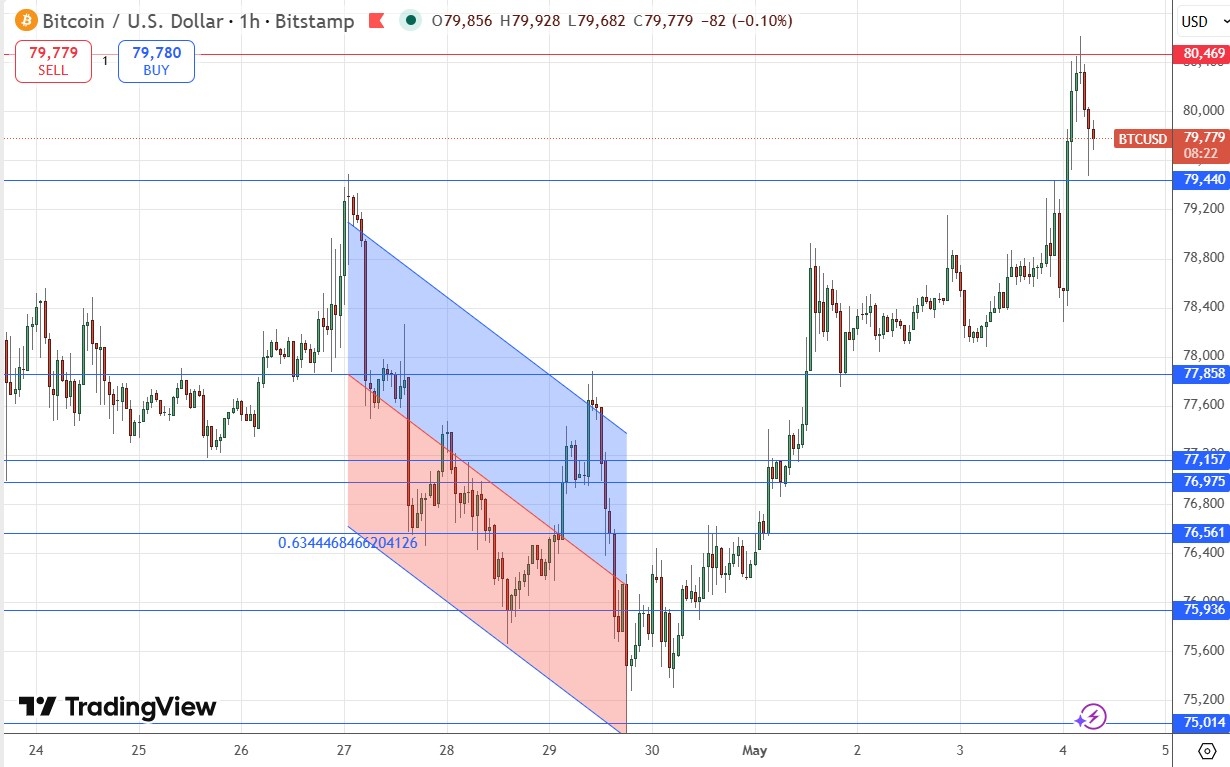
In my last BTC/USD forecast last Thursday, I thought that the key thing to watch out for on the bullish side would be a breakout above the $77,000 area, which was confluent with the upper trend line of the descending linear regression analysis.
I was also looking for a breakout beyond $78,000.
These breakouts did not happen until the next day, but I was correct in my analysis of seeing more potential on the bullish side and seeing these as significant breakouts. After crossing $78,000 the price has continued all the way to a level above $80,000 a few hours ago, reaching a new 3-month high price.
The bullish trend has continued and strengthened, with Bitcoin now moving more in line with US stock markets as a risk-on asset. This suggests that Bitcoin is being viewed more positively by the market and should be interesting to speculators again.
Bulls do have an issue – the price just printed new key resistance at $80,469 that had a bearish impact when reached. This level looks likely to be pivotal today.
A buy on a dip to $77,858 and a bounce there could be a nice trade if it sets up.
A bullish breakout above the new resistance level at $80,469 will probably be an even better signal to enter a long trade, if the breakout is convincing. I like to see two consecutive hourly candlesticks closing higher above that level, with little upper wick on the second candlestick.
https://www.tradingview.com/chart?symbol=COINBASE%3ABTCUSD
There is nothing of high importance due today regarding either Bitcoin or the US Dollar.
Ready to trade our daily Forex signals? Here is our list of the best MT4 crypto brokers worth reviewing.