


Bearish view
Sell the BTC/USD pair and set a take-profit at 70,000.
Add a stop-loss at 80,000.
Timeline: 1-2 days.
Bullish view
Buy the BTC/USD pair and set a take-profit at 80,000.
Add a stop-loss at 70,000.
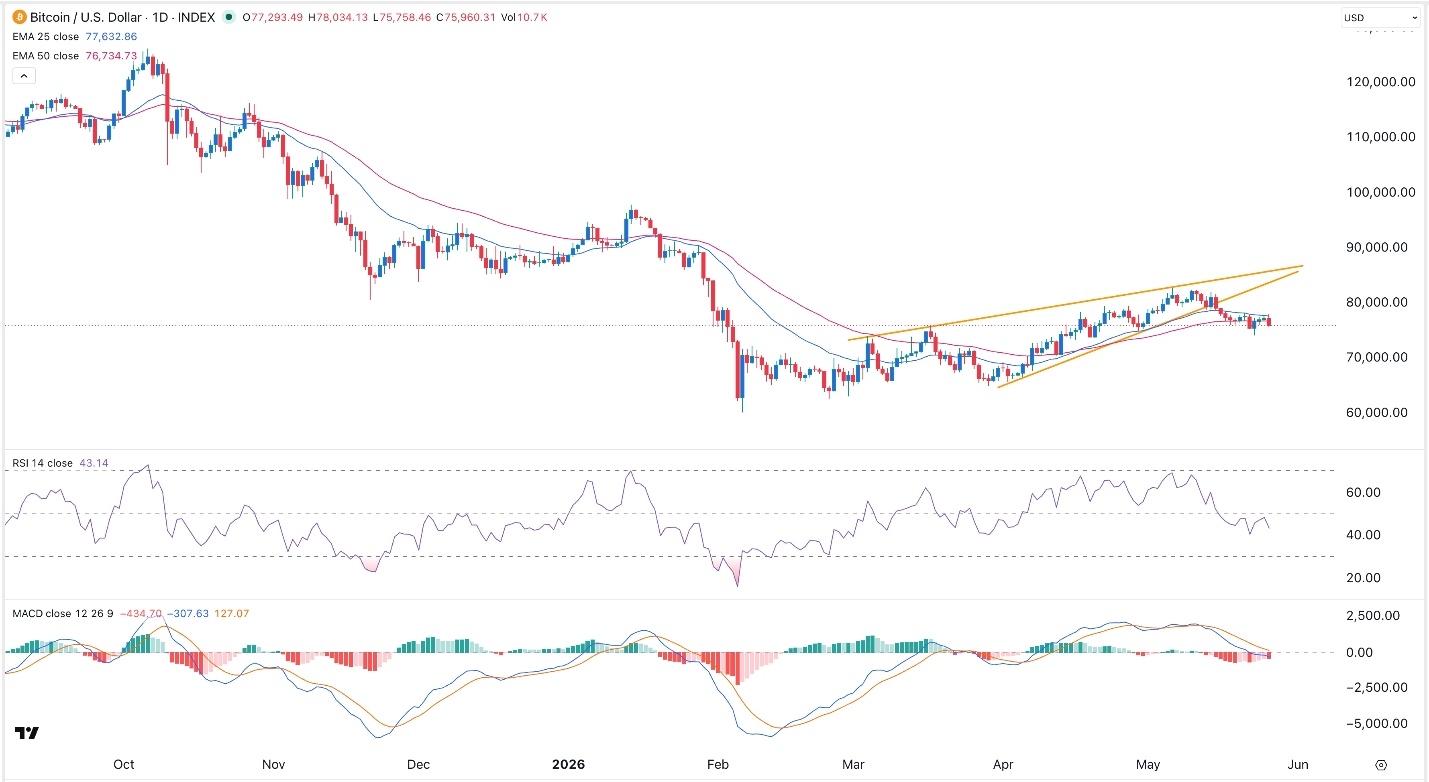
Bitcoin price retreated below the crucial support level at $76,000 as the recent rally lost momentum amid US-Iran risks. The BTC/USD pair was trading at 75,800 on Wednesday morning, a few points below this week’s high of over 78,000.
Top Regulated Brokers
Bitcoin Price Under Pressure as Risks Mount
The BTC/USD pair retreated as traders reacted to the rising risks in the industry. A major risk this week is the ongoing US-Iran negotiations on a deal that will lead to the gradual reopening of the Strait of Hormuz.
While the two sides continue to negotiate, there is a risk that they will not reach an agreement anytime soon. For example, the US military hit some Iranian targets in what officials called self-defense. Iran has vowed to retaliate, a move that may lead to an escalation.
At the same time, Israel has continued to hit targets in Lebanon, a move that may deter the two sides from reaching a deal. These fears explain why crude oil prices tilted a bit upwards on Wednesday.
Bitcoin’s fundamentals have also weakened a bit in the past few weeks. The most notable one is in the ETF market where outflows have jumped. These funds experienced outflows on Tuesday as the US markets reopened after the Memorial Day weekend. They have now lost over $1 billion in outflows this month, erasing the gains they made in the first six days of the week.
Bitcoin has also struggled as American investors have rotated to the high-flying technology companies. The stock market has jumped to a record high year, with top ETFs experiencing billions of dollars in inflows. For example, the AI boom helped Micron to achieve a $1 trillion valuation, joining other tech giants like NVIDIA, Microsoft, Taiwan Semiconductor, and Samsung.
BTC/USD Technical Analysis
The daily chart shows that the BTC/USD pair has pulled back sharply in the past few days. It has dropped from a high of 82,767 earlier this month to the current 75,983.
Bitcoin has already slipped below the 100-day Exponential Moving Average (EMA). It also plunged below the lower side of the rising wedge pattern, confirming its bearish outlook.
The two lines of the MACD indicator formed a bearish crossover on May 12 and have already moved below the zero line. In most cases, this performance normally leads to more downside.
Therefore, the pair will likely continue falling, with the next key target being at 70,000. On the other hand, a move above the key resistance at 80,000 will invalidate the bearish outlook.
Ready to trade our free daily Forex trading signals? We’ve shortlisted the best MT4 crypto brokers in the industry for you.