
Bullish view
Buy the EUR/USD pair and set a take-profit at 1.2000.
Add a stop-loss at 1.1670.
Timeline: 1-2 days.
Bearish view
Sell the EUR/USD pair and set a take-profit at 1.1670.
Add a stop-loss at 1.2000.
The EUR/USD exchange rate wavered on Tuesday as traders waited for the upcoming US retail sales and pending home sales data. It also moved sideways as the US-Iran crisis continued and as market participants waited for Kevin Warsh's confirmation hearings. It was trading at 1.1785, a few points below last week's high of 1.1850.
Kevin Warsh Confirmation Hearings and US Retail Sales Data
The EUR/USD pair will be in the spotlight on Tuesday as traders focus on some major events. A notable one is the upcoming confirmation hearing of Kevin Warsh, who aims to become the next Federal Reserve Chairman.
Warsh will likely be quizzed on the views of the economy, Federal Reserve independence, and what he expects to do once confirmed. Trump has pushed Jerome Powell and the committee to cut rates and has hinted that the next Chair’s main role will be to slash them.
The US will then release the latest US retail sales data, which will provide more color on the state of the economy as the war continued.
Economists polled by Reuters expect the data to show that sales rose from 0.6% in February to 1.4% in March. They also expect the report to show that sales rose 2.4% YoY, lower than the previous 3.7%.
The EUR/USD pair will also react to the latest pending home sales data, with economists expecting the report to show that sales rose by 0.7% YoY.
Meanwhile, the pair will also react to the ongoing US-Iran war, with the ceasefire expected to end on Wednesday this week. In a statement on Monday, Trump said that he will not extend the ceasefire, raising the possibility that the war will continue in the foreseeable future.
EUR/USD Technical Analysis
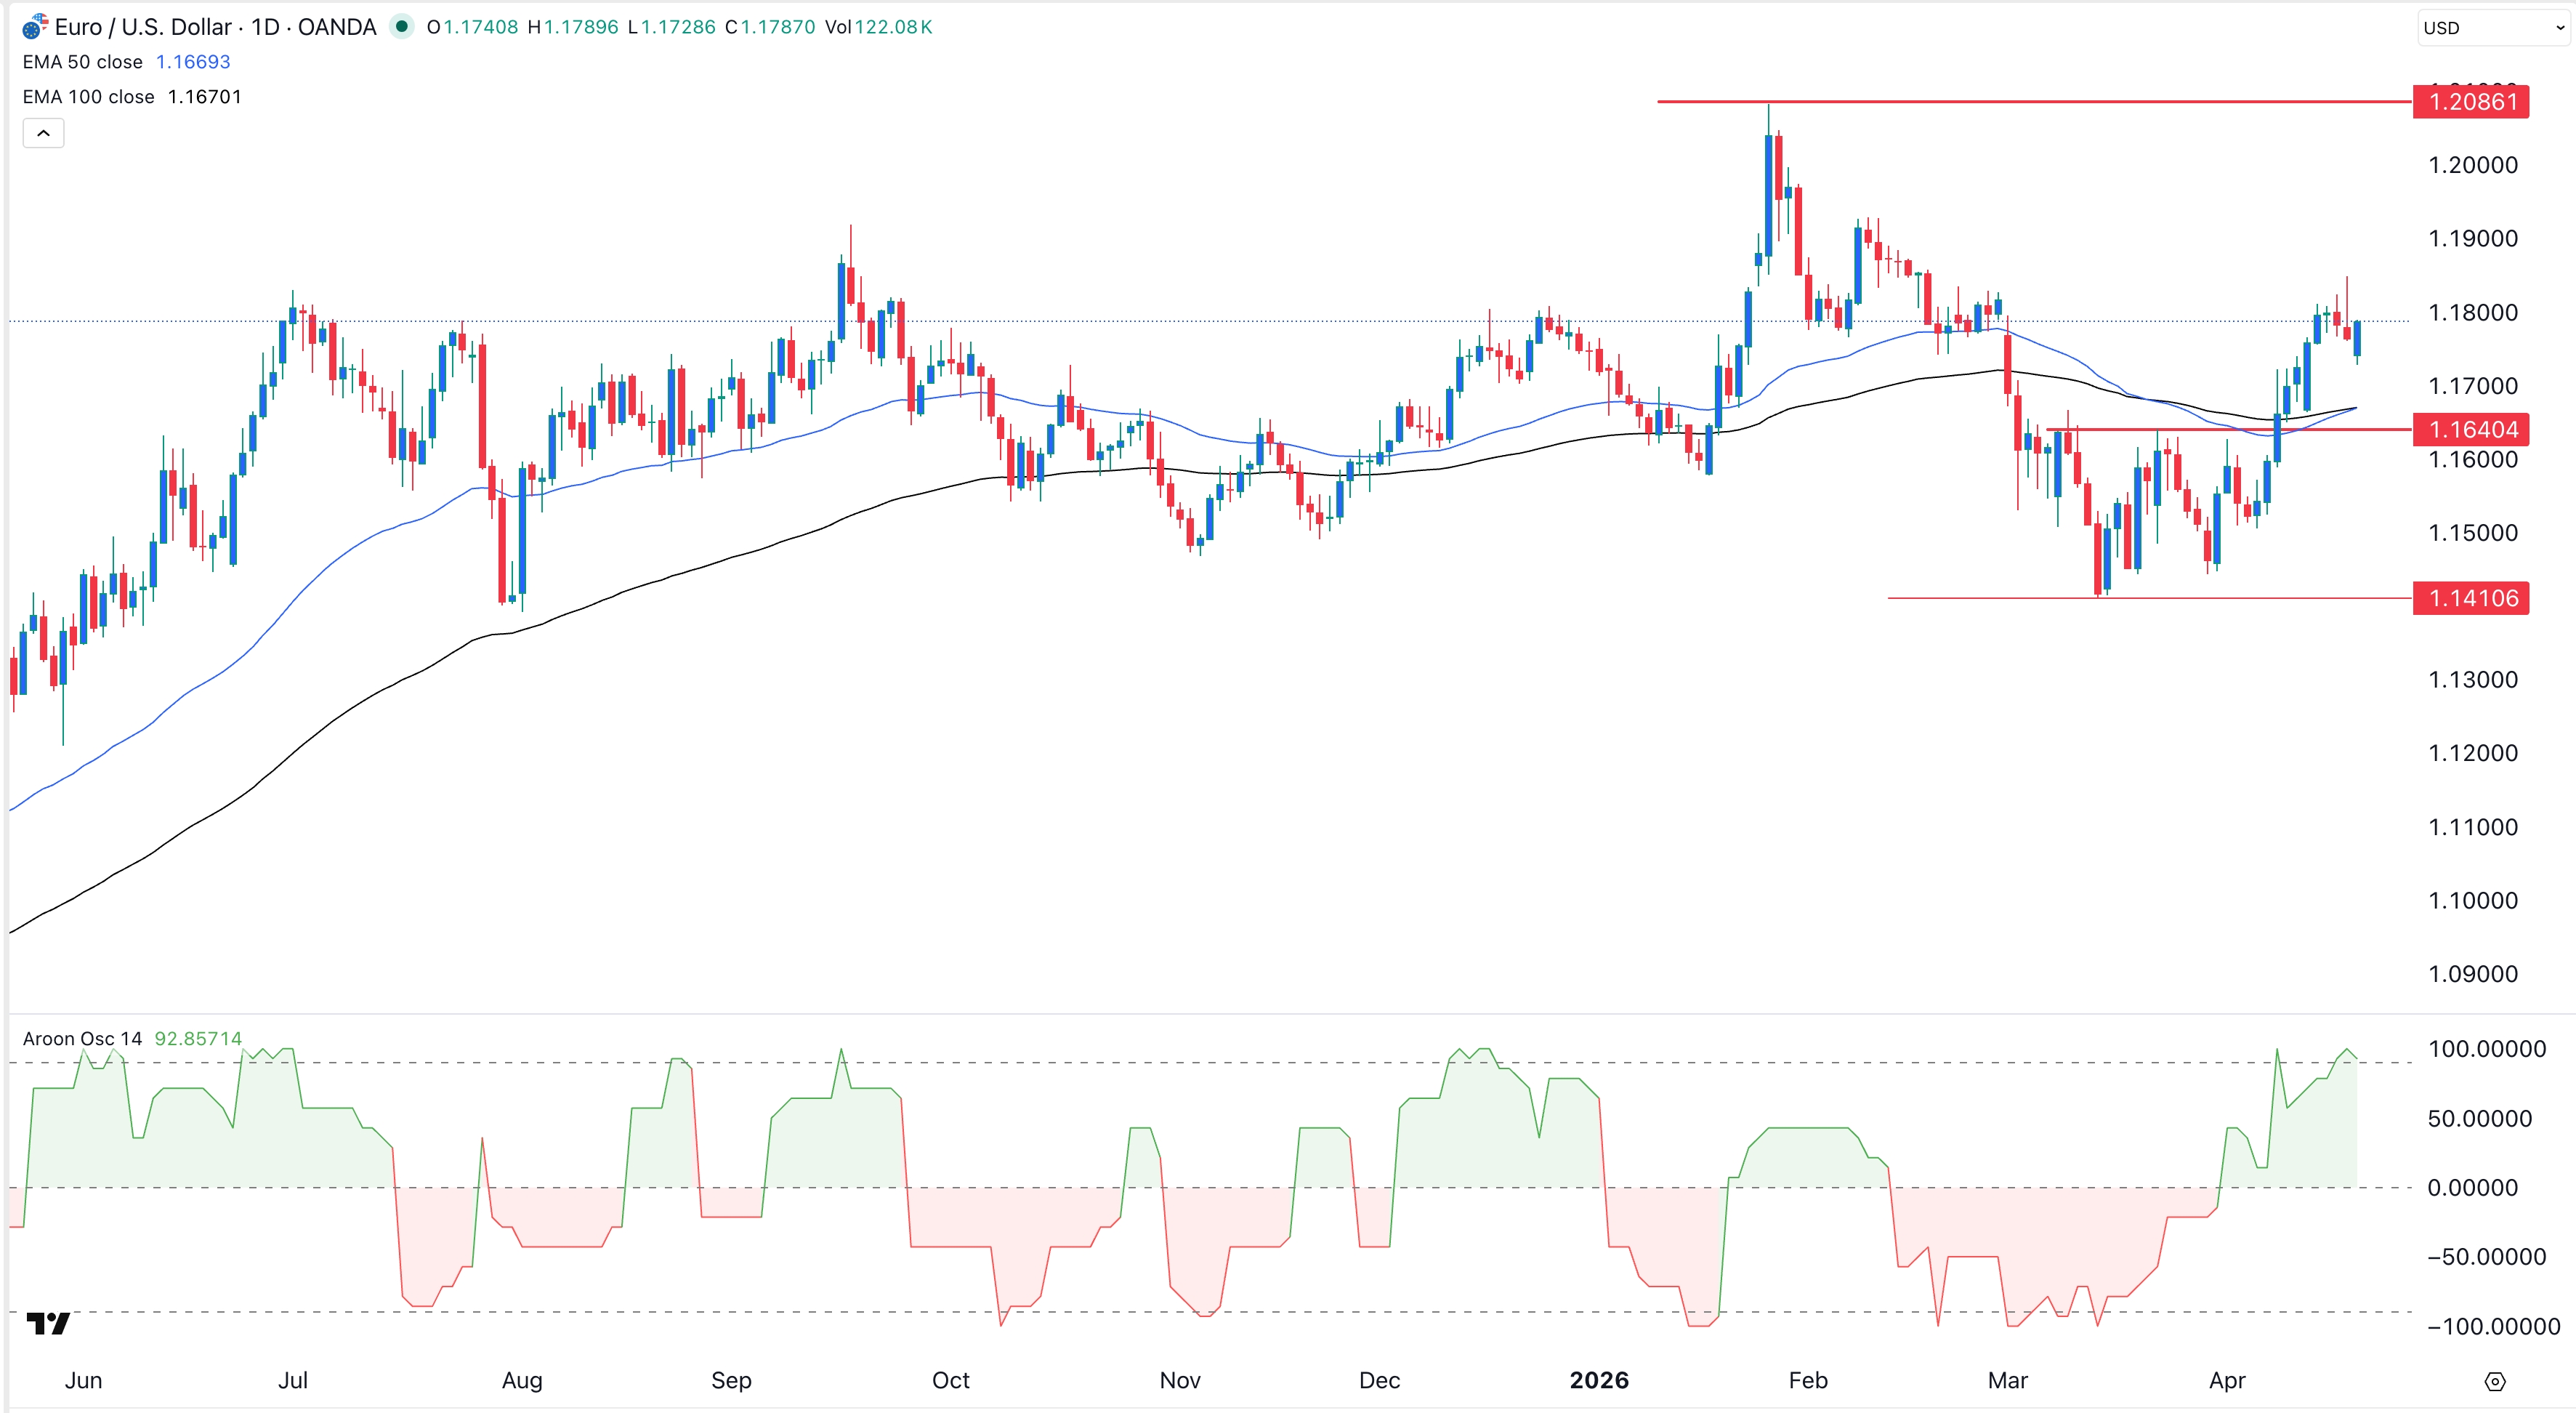
The daily timeframe chart shows that the EUR/USD pair has rebounded in the past few weeks, moving from a low of 1.1410 to the current 1.1785. It moved above the important resistance level at 1.1640, its highest level on March 23rd.
The pair has formed a mini golden cross pattern as the 50-day and 100-day Exponential Moving Averages (EMA) have crossed each other. It has also moved above the Ichimoku cloud indicator.
At the same time, the Aroon Oscillator has jumped to the overbought level of 100, a sign that it has a bullish momentum.
Therefore, the path of the least resistance for the pair is bullish, with the next key target being the psychological level at 1.2000.