
Short Trade Idea
Enter your short position between $76.32 (yesterday’s intra-day low) and $78.19 (yesterday’s intra-day high).
Market Index Analysis
Cisco Systems (NASDAQ:CSCO) is a member of the NASDAQ 100 Index, the Dow Jones Industrial Average Index, the S&P 100 Index, and the S&P 500 Index.
All four indices are rebounding from 2026 lows, but with below-average bullish trading volumes.
The Bull Bear Power Indicator for the S&P 500 Index is bearish with a descending trendline.
Market Sentiment Analysis
Equity futures are higher following a powerful rally to close a dismal first quarter after Iran’s President Pezeshkian stated that his country is open to de-escalation under certain conditions, while US President Trump added that the US will end the Iran war in two to three weeks. Still, oil prices remain above $100, and the economic repercussions remain uncertain. Retail sales, ADP, and ISM manufacturing data could also move the market today.
Cisco Systems Fundamental Analysis
Cisco Systems is a technology company known for its networking, security, software, and cloud computing solutions. It has also faced allegations of collaborating with the NSA’s Tailored Access Operations (TAO) unit to intercept network gear.
So, why am I bearish on CSCO despite its AI-driven growth momentum?
Cisco faces ongoing margin pressures amid surging DRAM and memory component costs, which prompted numerous analyst downgrades. Management warned that margins may remain under pressure. I am equally bearish on the market-share erosion in its cybersecurity business amid its rotation to cloud subscriptions. Product reliability following the discovery of critical vulnerabilities in its SD-WAN and firewall products is another concern.
Metric | Value | Verdict |
P/E Ratio | 27.91 | Bullish |
P/B Ratio | 5.76 | Bearish |
PEG Ratio | 1.63 | Bullish |
Current Ratio | 0.95 | Bearish |
ROIC-WACC Ratio | Positive | Bullish |
Cisco Systems Fundamental Analysis Snapshot
The price-to-earnings (P/E) ratio of 27.91 makes CSCO an inexpensive stock. By comparison, the P/E ratio for the NASDAQ 100 Index is 34.76.
The average analyst price target for CSCO is $88.81. It suggests good upside potential, but downside risks are greater.
Cisco Systems Technical Analysis
Today’s CSCO Signal
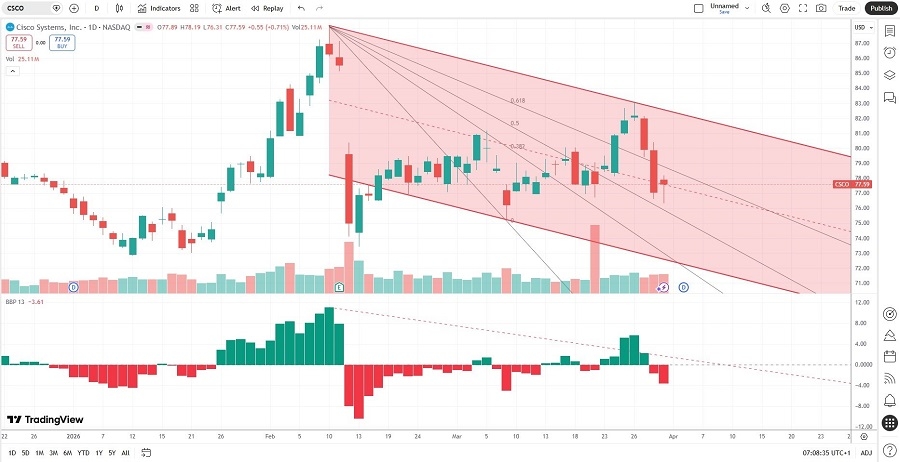
Cisco Systems Price Chart
The CSCO D1 chart shows price action inside a bearish price channel.
It also shows price action between its descending 50.0% and 61.8% Fibonacci Retracement Fan levels.
The Bull Bear Power Indicator is bearish with a descending trendline.
The average bearish trading volumes are higher than the average bullish trading volumes.
CSCO retreated as the NASDAQ 100 Index recovered, a bearish confirmation.
My CSCO Short Stock Trade
CSCO Entry Level: Between $76.32 and $78.19
CSCO Take Profit: Between $62.30 and $64.85
CSCO Stop Loss: Between $83.11 and $87.14
Risk/Reward Ratio: 2.07
Ready to trade our analysis of Cisco Systems? Here is our list of the best stock brokers worth checking out.