
Bitcoin holds steady above the $68,000 psychological level despite recent market volatility. Spot Bitcoin ETF inflows have returned, reflecting strong institutional confidence among other BTC price recovery signals.
Spot BTC ETF Inflows Hit Six-week Highs
Institutional demand for BTC soars to six-week highs as US-based spot Bitcoin ETFs see $471 million in net inflows on April 6, the highest since Feb. 25, data from SoSoValue shows.
This reversal from earlier outflow trends marks a significant shift, with major funds including BlackRock’s IBIT and Fidelity’s FBTC driving the bulk of the buying pressure, with $181.9 million and $147.3 million in inflows, respectively.
The inflows coincide with Bitcoin stabilizing near $68,000, providing a critical buffer against selling from short-term holders and retail investors.
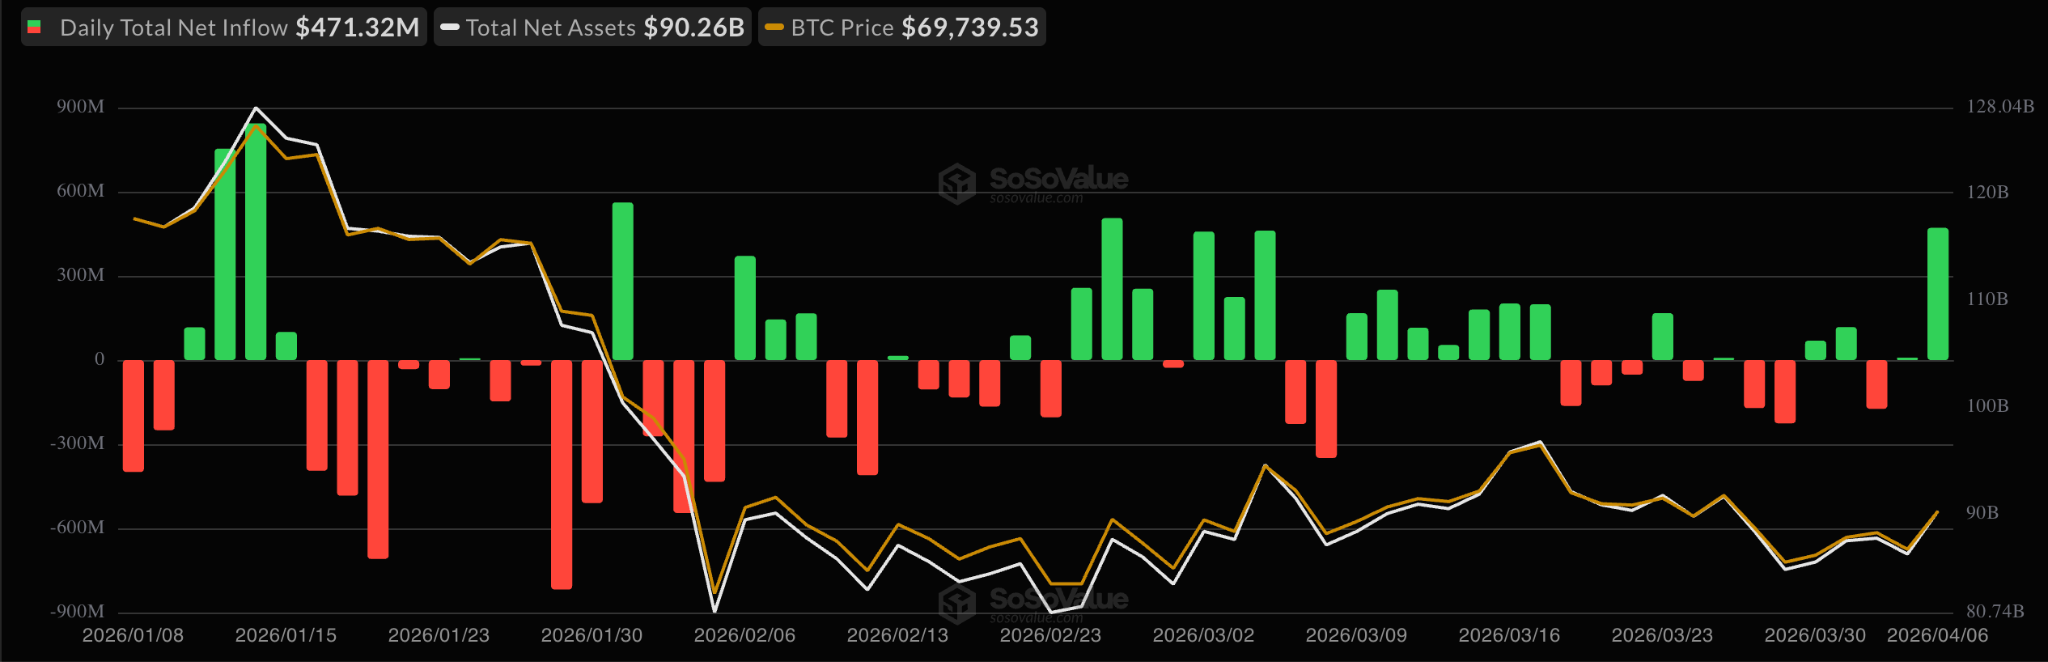
Spot Bitcoin ETF flows chart. Source: SoSoValue
Such robust institutional participation directly bolsters BTC’s price trajectory going forward. ETFs act as a steady demand engine, absorbing coins that might otherwise hit open-market sell orders and reducing available liquidity for bears.
Historical patterns show that sustained daily inflows above $300 million often precede multi-week rallies, as seen in late 2024 and early 2025 cycles. With April 6 marking the strongest single-day net inflow in over a month, analysts expect this momentum to lift overhead resistance near $70,000–$72,000 if inflows persist.
The capital injection also signals broader market sentiment turning positive, encouraging retail and corporate adoption while countering macroeconomic headwinds like interest rate uncertainty.
Overall, these flows create a structural floor, making downside breaks below $65,000 less probable and positioning Bitcoin for gradual upside as long-term conviction among institutional investors deepens.
Onchain Data Supports Bitcoin’s Recovery
On-chain metrics from Glassnode and similar platforms paint a constructive picture for Bitcoin’s near-term rebound.
One key bullish signal is the percent of supply in profit, which has recovered toward 60 percent. This level historically aligns with early-stage recoveries from cycle lows, where exhaustion gives way to renewed buying without aggressive distribution.
Reduced realized profit-taking further supports this view, with seven-day smoothed realized profits dropping sharply from peaks above $3 billion daily in late 2025 to moderate levels muted below $500 million, indicating sellers are exhausted, and holders are opting to accumulate rather than exit.
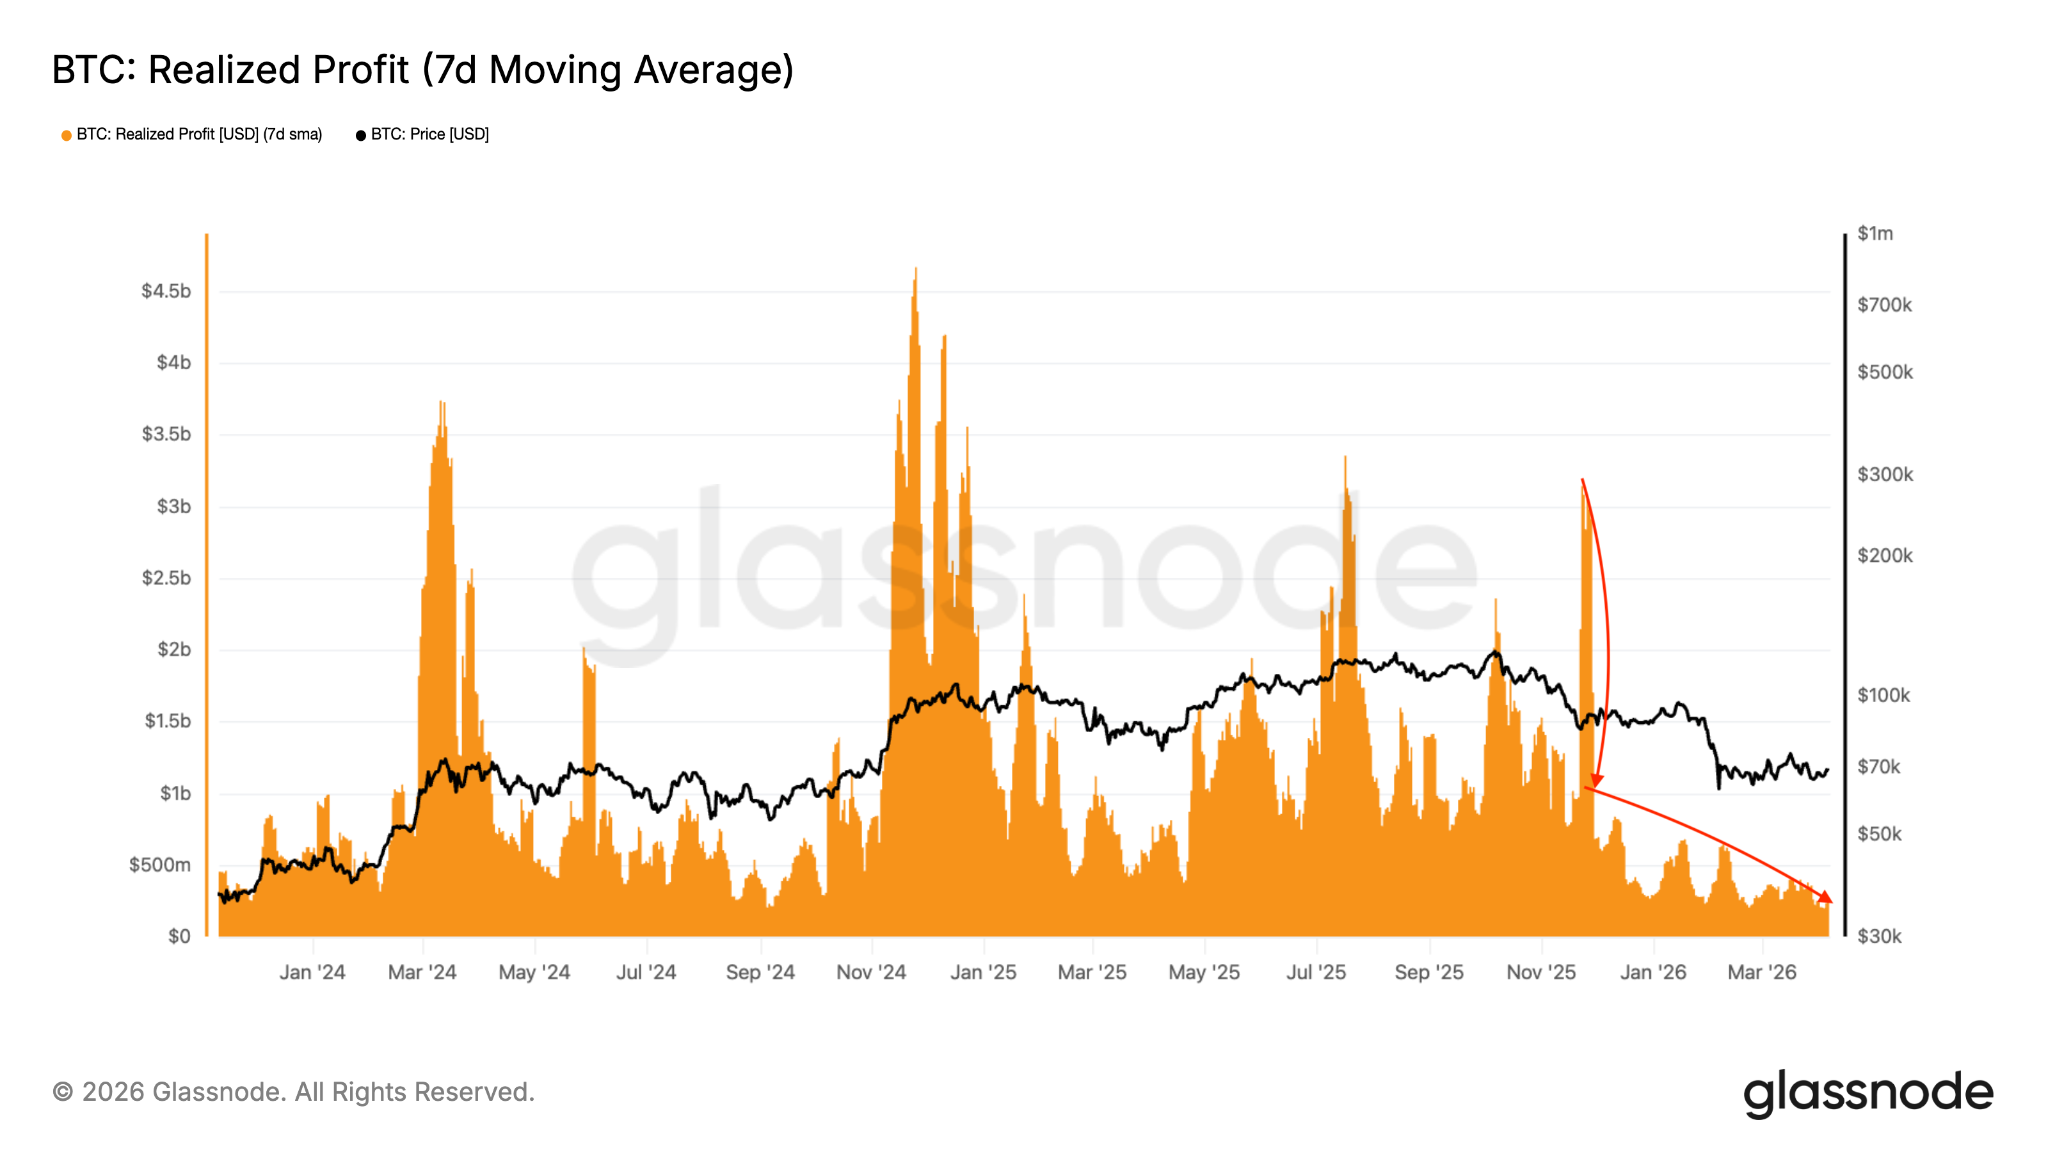
Bitcoin: Realized profit. Source: Glassnode
Mid-tier entities (10 - 1,000 BTC wallets) have resumed net accumulation, absorbing coins from weaker hands and adding organic demand depth.
Long-term holder supply is stabilizing after months of decline, with net profit realization slowing to roughly 12,800 BTC weekly - far below cycle-peak levels.
The market value to realized value (MVRV) ratio has rebounded from deeply oversold territory, hovering near levels that previously marked transition points from bearish to neutral phases.
Additionally, transfer volumes are improving modestly while active addresses remain steady, suggesting quiet capital rotation rather than panic. Exchange reserves continue their multi-year downtrend as investors shift to self-custody, limiting immediate sell-side pressure.
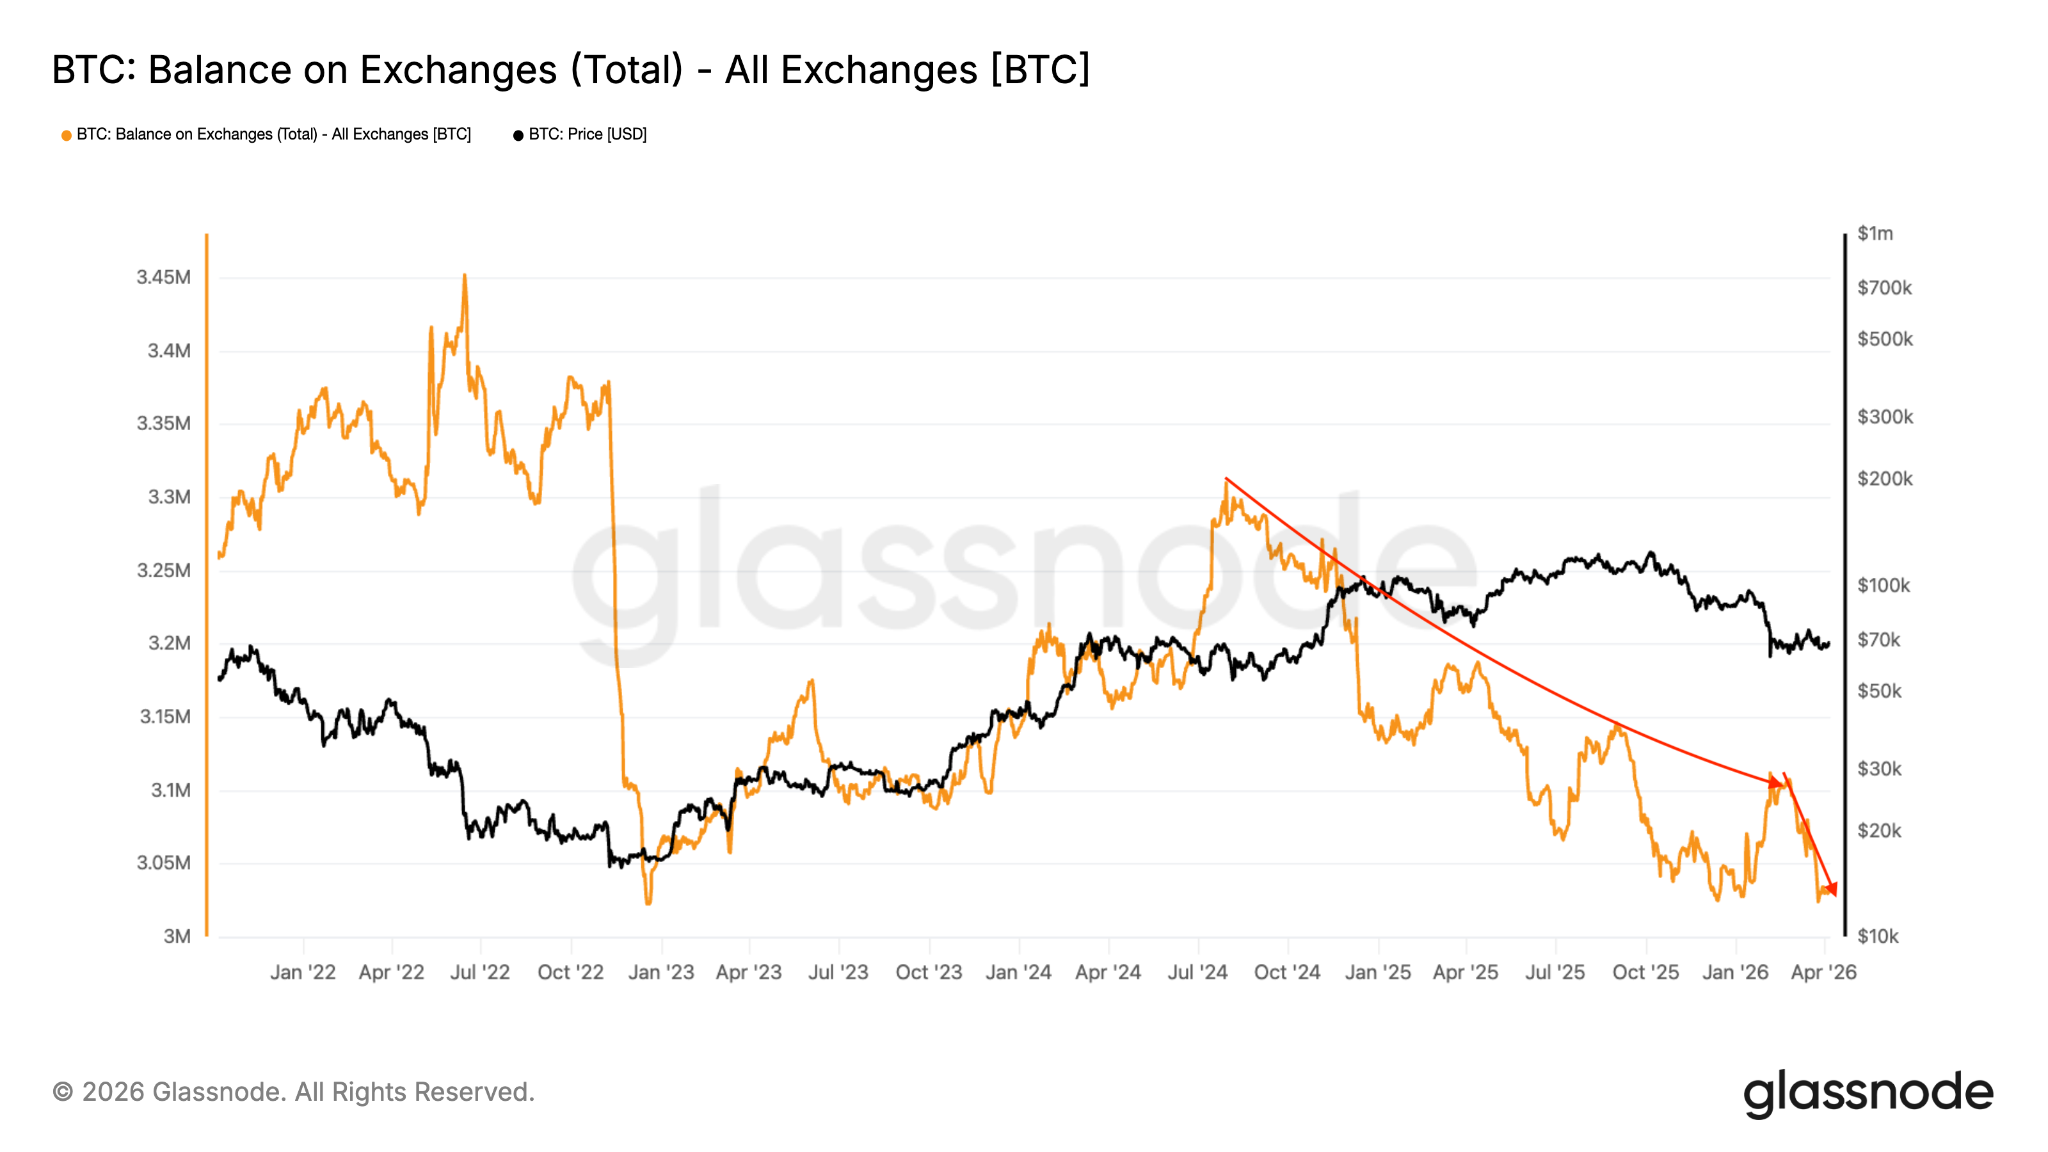
Bitcoin balance on exchanges. Source: Glassnode
Collectively, these metrics indicate Bitcoin is building a foundation for recovery. Unlike previous false rallies driven by leverage, current on-chain behavior reflects genuine conviction from seasoned participants.
If ETF inflows remain elevated and short-term holder MVRV crosses back above 1.0, the data points to a sustainable uptrend, potentially targeting prior resistance zones as supply tightens.
Bitcoin Price Sits on Strong Support Above $68K
Bitcoin’s price action demonstrates resilience, consolidating just within the $60,000-$70,000 range, with multiple technical indicators confirming a solid support base.
Key moving averages, including the 50-day and 200-week exponential moving averages, are converging in the $65,000 - $68,000 zone, creating a dynamic confluence that has repeatedly absorbed selling pressure.
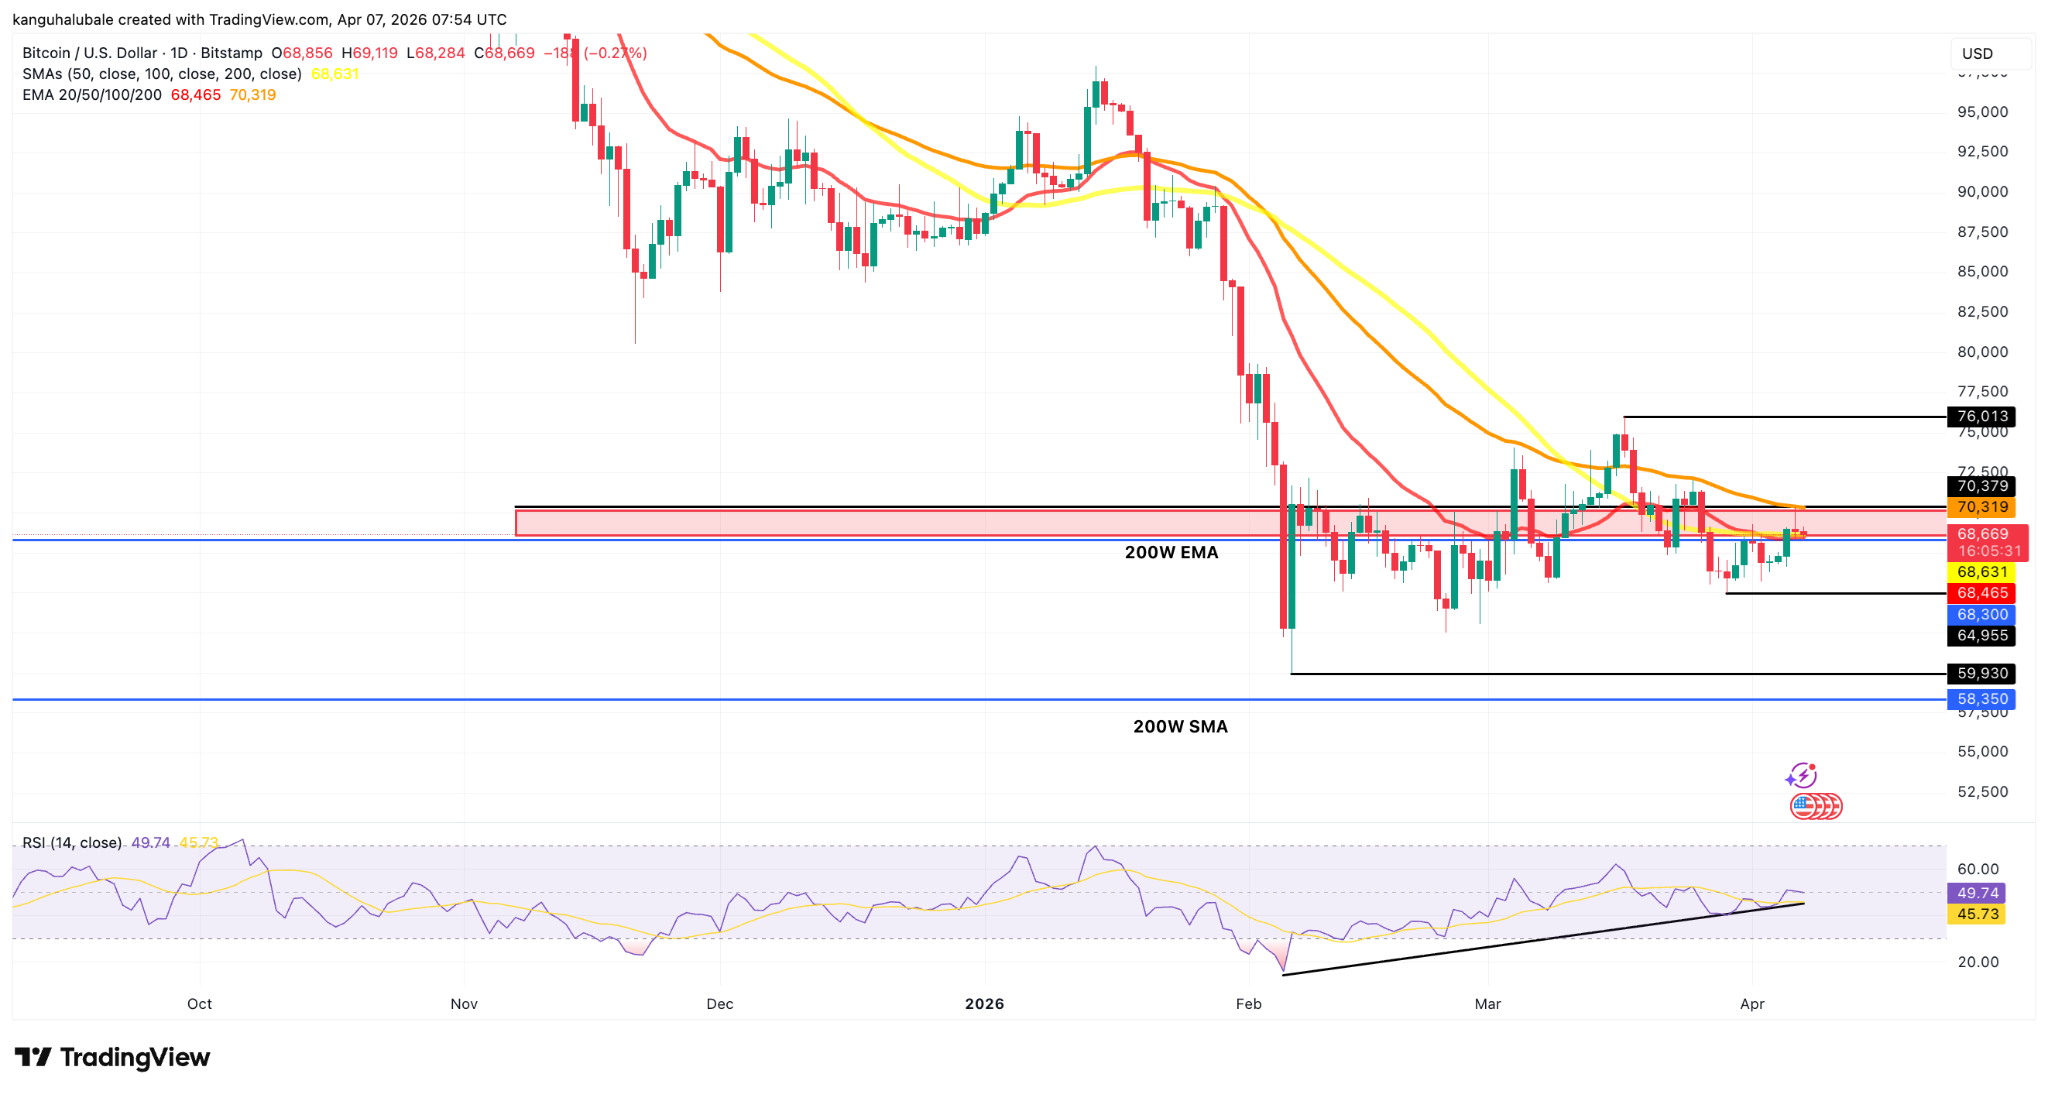
BTC/USD daily chart. Source: TradingView
The RSI reading on the daily timeframe has risen from oversold conditions, suggesting room for upside momentum without immediate exhaustion.
Volume profiles show thinning sell-side liquidity above current levels, while buy-side clusters strengthen near $68,000.
Glassnode’s cost basis distribution heatmap provides further validation. Dense bands of coins acquired between $62,000 and $68,000 by short-term holders create a thick support layer, as holders at or near breakeven are less inclined to sell during minor dips. This is where investors acquired approximately 430,000 BTC over the last three months.
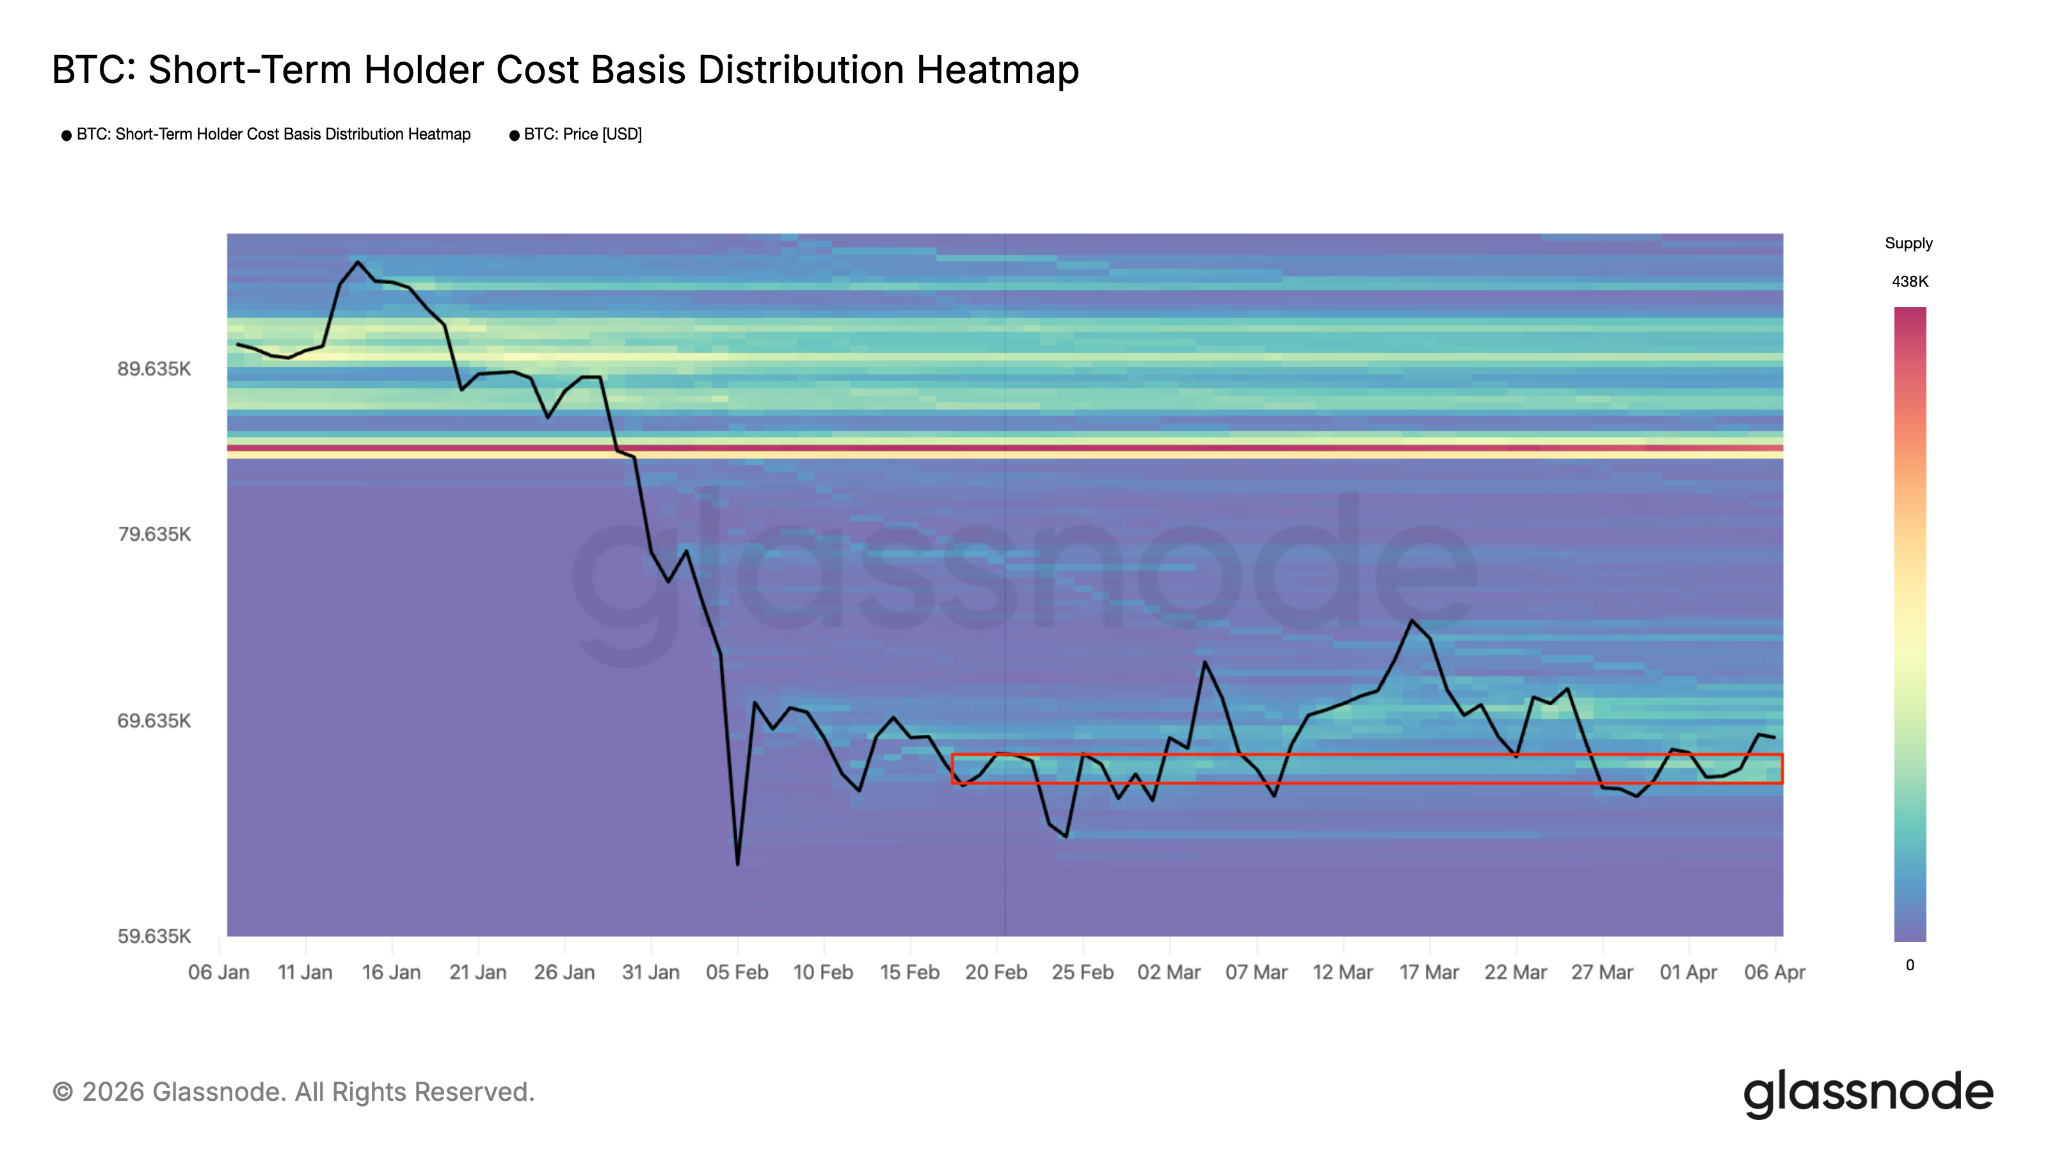
Bitcoin STH cost basis distribution heatmap. Source: Glassnode
This on-chain structure aligns with the current price holding firm, turning former resistance into support.
While some caution remains about potential retests to $65,000 if global liquidity tightens, the consensus leans bullish provided ETF demand and on-chain accumulation persist.
Overall, the combination of technical confluence and heatmap data positions Bitcoin favorably for continuation higher once overhead supply is cleared.
We hope you enjoyed reading our analysis of Bitcoin. If you’d like to trade with one of the best crypto CFD brokers, check out our list