
Bearish view
- Sell the BTC/USD pair and set a take-profit at 60,000.
- Add a stop-loss at 71,000.
- Timeline:1-2 days.
Bullish view
- Buy the BTC/USD pair and set a take-profit at 71,000.
- Add a stop-loss at 60,000.
Bitcoin price was relatively unchanged on Wednesday morning, continuing a consolidation period that has been going on in the past few weeks. The BTC/USD pair was trading at 67,250, much lower than the all-time high of 126,400.
Bitcoin has struggled this month as investors remained concerned about the falling futures open interest, which is a sign of weak demand. The interest has dropped to $40 billion, down sharply from last year's high of over $95 billion.
Top Regulated Brokers
Bitcoin retreated as the spot ETF outflows continued, a sign that Americans are still wary of investing in the coin. Data shows that spot ETFs have shed over $700 million this month and over $6 billion in the last four months. A good example of this is Harvard University, which reduced its positioning.
The next important catalyst for the BTC/USD pair will be the upcoming Federal Reserve minutes, which will come out later on Wednesday. Economists expect these minutes to provide more information about the last interest rate meeting and what officials thought.
A recent data showed that the headline Consumer Price Index (CPI) dropped to 2.4% in January, while the core inflation remained unchanged at 2.5%. In a statement on Tuesday, Austan Goolsbee said that he supported more interest rate cuts if inflation continued moving downwards in the past few months.
BTC/USD Technical Analysis
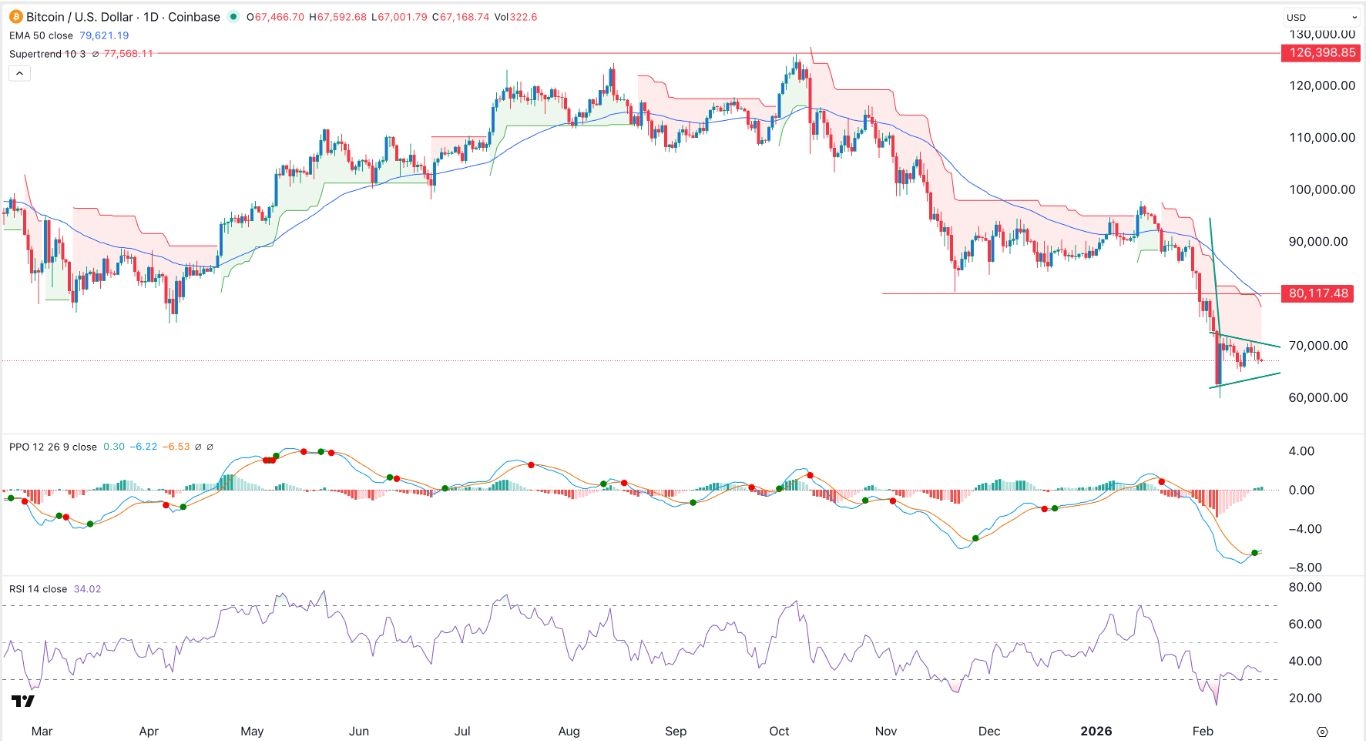
The daily timeframe chart shows that the Bitcoin price has come under intense pressure in the past few months, moving from a high of 126,300 in October to the current 67,000. It has slipped below the key support level at 80,117, its lowest level in November last year.
The Supertrend indicator has remained in the red since January 19. Also, it has dropped below the 50-day and 100-day Exponential Moving Averages (EMA).
The coin has also formed a bearish pennant pattern, which is made up of a vertical line and a symmetrical triangle. Also, the Percentage Price Oscillator has remained below the zero line, while the Relative Strength Index (RSI) remains near the oversold level.
Therefore, the most likely Bitcoin price forecast is bearish, with the next key target to watch being the year-to-date low of 60,000. A move above the 50-day moving average at 79,000 will invalidate the bearish outlook.