Fundamental Analysis & Market Sentiment
I wrote on the 9th November that the best trades for the week would be:
- Long of the USD/JPY currency pair following a daily close above ¥154.25. This set up at Wednesday’s close and the price has fallen by 0.14% since then.
- Long of the S&P 500 Index following a daily close above 6,920. This did not set up.
- Long of the NASDAQ 100 Index following a daily close above 26,288. This did not set up.
These trades produced an overall loss of 0.14%, representing an average loss of 0.05% per asset.
A summary of last week’s most important data:
- UK GDP – this was marginally worse than expected, showing a month-on-month contraction of 0.1% when no change was widely expected. This may have made the British Pound very slightly weaker.
- Australia Unemployment Rate – better than expected, falling to 4.3%, more than the anticipated 4.4%.
- UK Unemployment Claims – slightly worse than expected.
There were a few important US data items which were due last week, but they were postponed due to the ongoing US federal government shutdown: CPI (inflation), PPI, and Retail Sales.
Last week saw an end to the longest-running federal government shutdown in US history. As it became clear that the shutdown would be ending, markets saw a risk-on rally, but it did not last. Stock markets ended the week mostly unchanged but were looking more bearish at the end of the week than they did at the start of last week.
It may be that the most interesting and significant thing which happened over the past week was the CME FedWatch tool showing the market moved from pricing a 63% chance of a 0.25% rate cut by the US Federal Reserve at its upcoming 10th December meeting, to a 44% chance. This shift in sentiment should be negative for stock markets and positive for the US Dollar, and may be contribution to the weakness seen in major stock markets last week.
Top Regulated Brokers
The Week Ahead: 17th – 21st November
The coming week will see US non-farm payrolls data, as well as inflation prints from the UK and Canada, as well as a release of the minutes of the Federal Reserve’s most recent meeting. If any of the data is significantly surprising, it could be an interesting week. It looks like we will not get a release of the US CPI data that was missed during the government shutdown.
This week’s most important data points, in order of likely importance, are:
- US Average Hourly Earnings
- US FOMC Meeting Minutes
- US Non-Farm Employment Change
- UK CPI (inflation)
- Canada CPI (inflation)
- Australia Wage Price Index
- USA / Germany / UK Flash PMI Services & Manufacturing
- US Unemployment Rate
- UK Retail Sales
- US Unemployment Claims
Volatility this week is likely to be at least as high, and possibly higher, than the volatility last week.
Monthly Forecast November 2025

Currency Price Changes and Interest Rates
For the month of November 2025, I forecasted that the USD/JPY currency pair would increase in value.
Its performance so far is shown within the table below.

November 2025 Monthly Forecast Performance to Date
Weekly Forecast 16th November 2025
Last week, I forecasted that the NZD/JPY currency cross would rise in value. It did, by 1.69%.
There was one unusually large price movement in currency crosses last week, so I forecast that the CHF/JPY currency cross is likely to fall in value over the coming week, despite the long-term strength in the Swiss Franc.
The Swiss Franc was the strongest major currency last week, while the Japanese Yen was the weakest. Directional volatility increased slightly last week, with 26% of all major pairs and crosses changing in value by more than 1%.
Next week’s volatility will probably be very similar to last week’s.
You can trade these forecasts in a real or demo Forex brokerage account.
Technical Analysis
Key Support/Resistance Levels for Popular Pairs
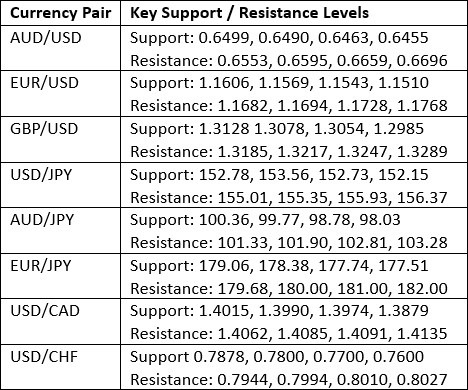
Key Support and Resistance Levels
US Dollar Index
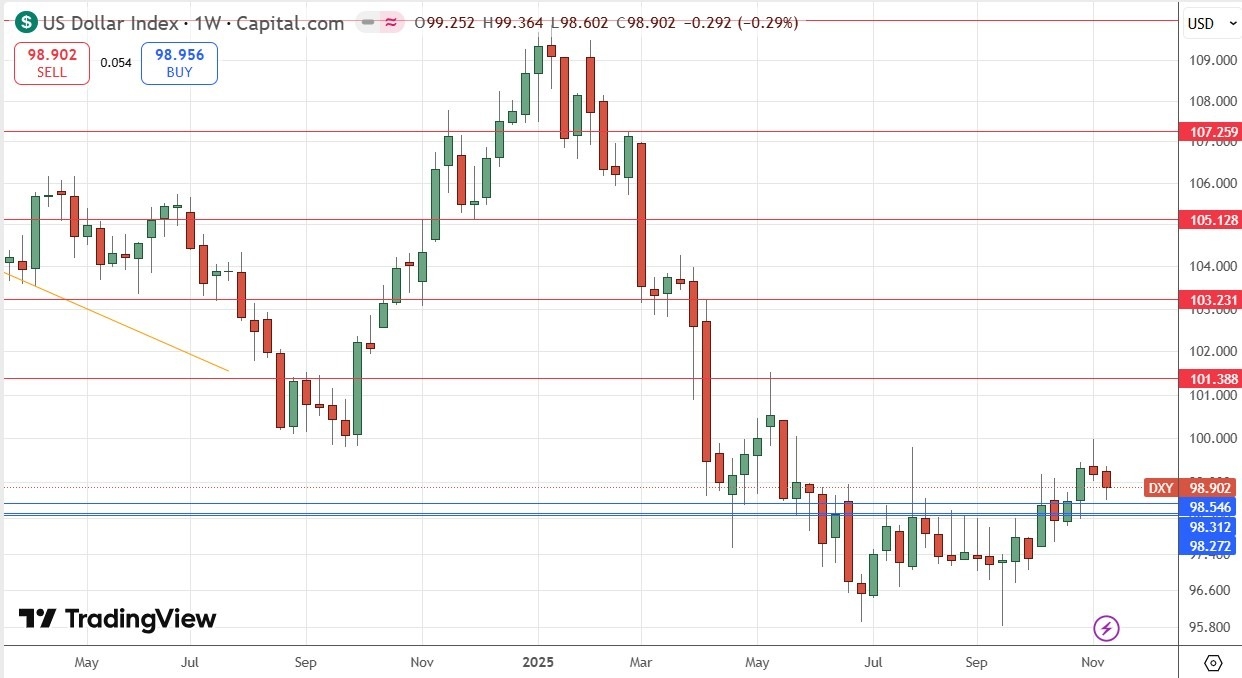
Last week, the US Dollar Index printed a weakly bearish candlestick with a significant lower wick. Despite the lower close, the price is now above its levels of both 13 and 26 weeks ago, , so by my preferred metric, I can declare a long-term bullish trend has begun. Another bullish confirmation technically comes from the fact that the price is holding up above the nearest key support levels, with 98.55 looking crucial.
The Dollar got a boost towards the end of the week, as expectation for a December rate cut by the Fed fell to become a minority expectation, with market pricing now suggesting an only 44% chance.
We are missing crucial US data on inflation and inflation-related metrics due to the US government shutdown. I think that although gains may be very muted, even sometimes turning into losses, we see such a technical long-term bottom below the big support levels at and below 98.55, that as long as the price holds up above this level, I will keep a bullish bias.
I am still more comfortable being long than short of the USD.
US Dollar Index Weekly Price Chart
USD/JPY
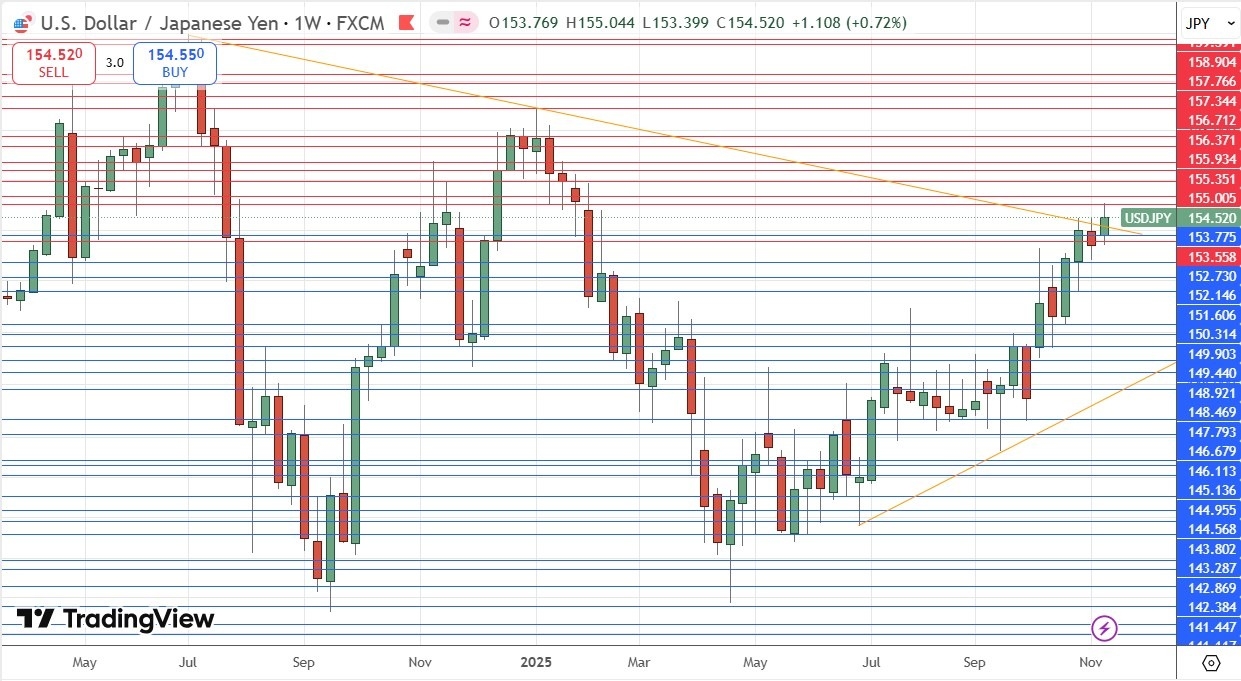
The USD/JPY currency pair weekly chart printed a weakly bullish candlestick that briefly made a new 9-month high, but gave up some gains, creating a significant upper wick. Although momentum is not very strong, we have seen a confirmed breakout beyond the upper trend line of the consolidating triangle chart pattern, which is a bullish sign.
The US’s Dollar is starting to get into a new long-term bullish trend. Although the Japanese Yen has a lot of long-term weakness, inflationary pressures and hence pressures for the Bank of Japan to conduct another rate hike after years and years of ultra-loose monetary policy, are growing, which puts a bit of a question mark over being short of that currency.
More cautious traders might wish to wait for a daily (New York) close above the big round number at ¥155.00, which has been touched, but has not yet been overcome.
USD/JPY Weekly Price Chart
CHF/JPY
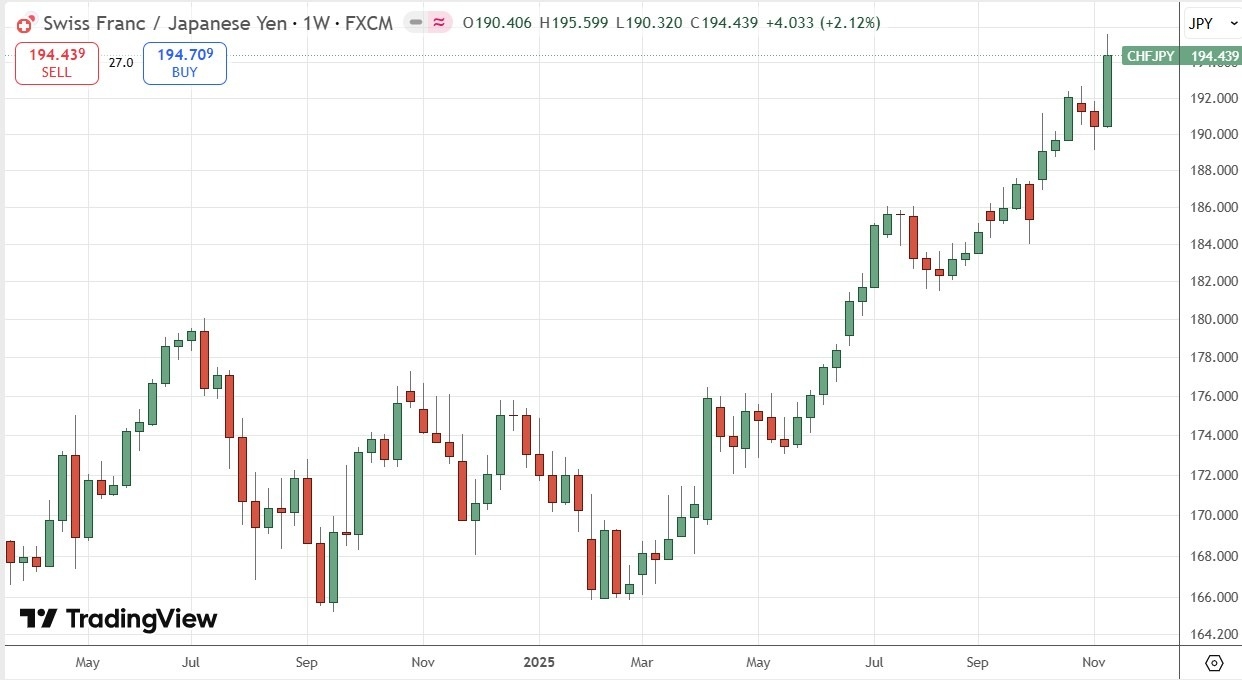
The CHF/JPY currency cross weekly chart printed a bullish candlestick. The week’s range was unusually large, and the price made yet another all-time high price.
There is a notable upper wick on the candlestick, which was formed at the end of last week, suggesting that the bullish move had run out of momentum, at least over the short term.
In my earlier analysis of USD/JPY I’ve explained the Yen weakness. Even more of a factor here, is the extremely solid long-term strength in the Swiss Franc. This is due to Switzerland’s deflationary inflation rate and zero rate of interest, which shows its position as the number one safe haven currency of the present time.
Despite the strong bullish trend, and the fact that I am already short of the Japanese Yen, going long in this cross right now might not be a good idea – we are likely due a pullback this week. Sophisticated traders might wait for the price to hit resistance in USD/CHF and in USD/JPY simultaneously before entering a new long trade.
CHF/JPY Weekly Price Chart
S&P 500 Index
The daily price chart below shows that this Index lost a little ground last week, making a clear lower high but rejecting last week’s low with another pin bar on the daily chart.
The price action suggests consolidation, but there is some bearish wind blowing. However, technically, we are still in a position where clearly it’s a bull market and long-term traders or investors will remain bullish. However, if the price closes one day below 6,620 that will shake out many longs, below 6,500, even more so, and this would likely trigger a steeper fall.
Watch out for a weekly close below 6,500 which would be a significant bearish development. However, if the price rises and makes a new high closing price, I would be happy to go long.
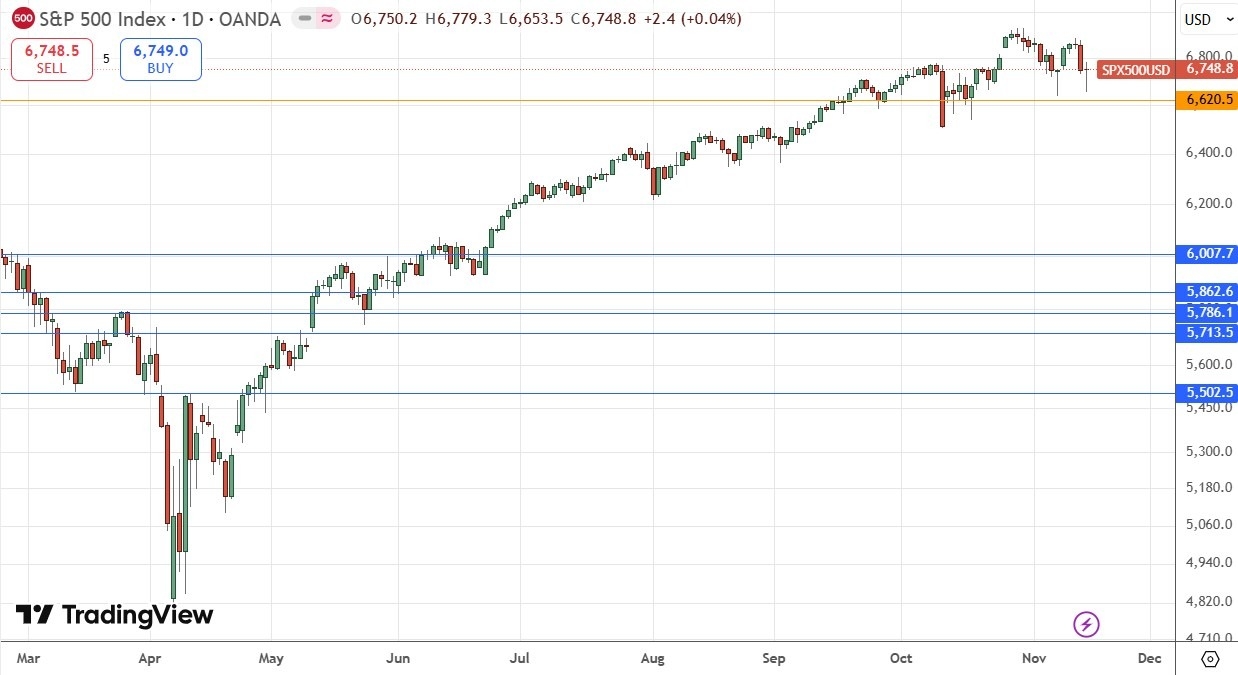
S&P 500 Index Daily Price Chart
Bitcoin/USD
I’ve noted recently that Bitcoin, despite being a risky asset, has not been gaining in recent weeks the way other risky asset such as stocks were.
I thought this was a bearish sign. I was proved right over this past week as we’ve seen the price break below $100,000 again but remain below this important big round number.
Another bearish sign is the size of last week’s candlestick, which is unusually large. Also, the price ended the week near this low. A bearish breakdown below $95,206 will probably produce a sharper fall.
Trend and momentum traders will be looking to be short of Bitcoin here, especially after a daily close below $95,000. I personally don’t like to short assets like Bitcoin, but there are certainly reasons here to be short.
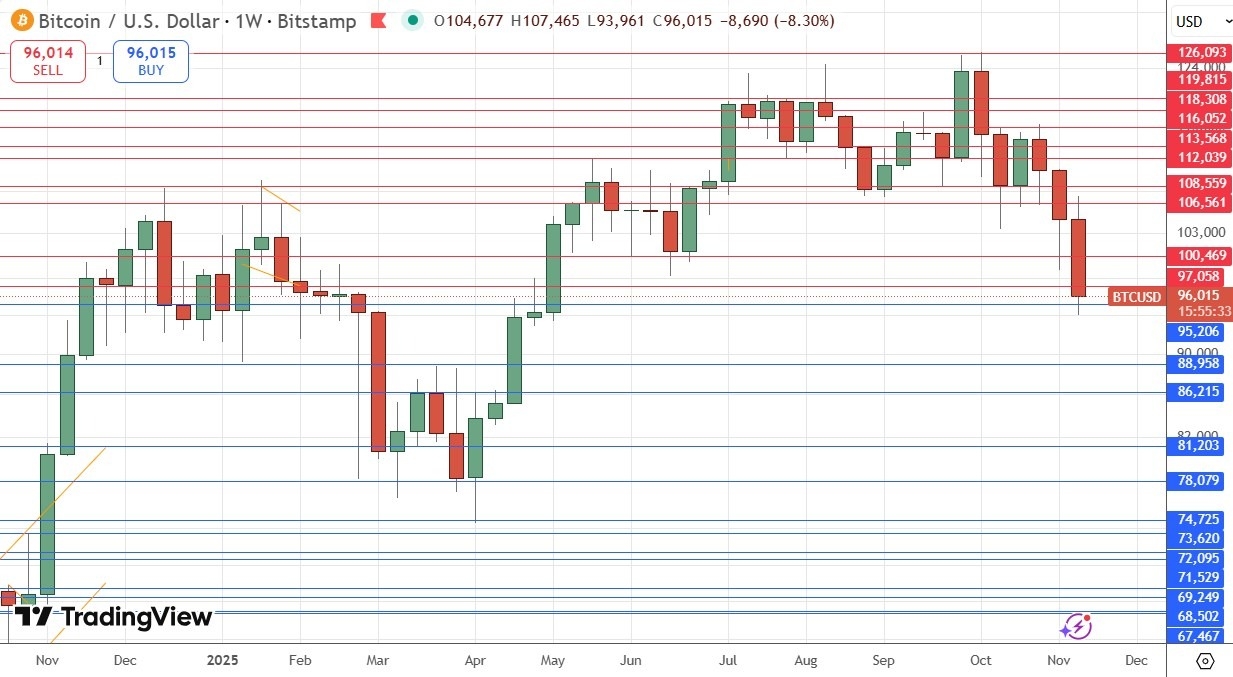
BTC/USD Weekly Price Chart
Bottom Line
I see the best trades this week as:
- Long of the USD/JPY currency pair.
- Long of the S&P 500 Index following a daily close above 6,920.
Ready to trade our weekly Forex forecast? Check out our list of the top 10 Forex brokers in the world.
