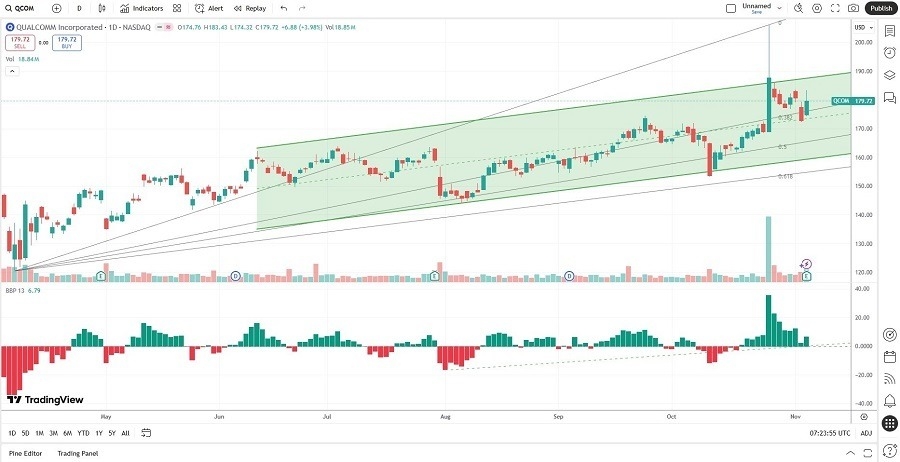
Long Trade Idea
Enter your long position between $172.29 (the intra-day low of its last bearish candle) and $183.43 (yesterday’s intra-day high).
Market Index Analysis
- Qualcomm (QCOM) is a member of the NASDAQ 100, S&P 100, and the S&P 500 indices.
- All three indices hover near record highs amid an expanding AI bubble, but lack market breadth, as bearish catalysts accumulate.
- The Bull Bear Power Indicator of the NASDAQ 100 index shows a negative divergence and does not support the uptrend.
Market Sentiment Analysis
Equity futures are moderately lower this morning. Super Micro Computer shares tanked, Qualcomm and Robinhood moved lower, joining a chorus of massively overvalued stocks that corrected after their earnings. E.l.f. Beauty reminded markets that tariffs have an impact, plunging 20%+, and yesterday’s ADP report showed no job creation in small companies with fewer than 250 employees, which traditionally account for 75% of all jobs. Warner Bros. Discovery, Airbnb, and Moderna highlight today’s earnings reports, followed by the Tesla shareholder meeting.
Qualcomm Fundamental Analysis
Qualcomm is a semiconductor and software company catering to wireless technology. It owns patents vital to the 5G, 4G, CDMA2000, TD-SCDMA, and WCDMA mobile communications standards. It has also begun expanding into non-mobile sectors to diversify its business.
So, why am I bullish on QCOM following its earnings release?
Qualcomm reported revenue of $11.27 billion with earnings per share of $3.00, beating analyst estimates of $10.77 billion and $2.88, respectively. QCOM provided an upbeat forecast, and I am encouraged by its diversification, especially automotive revenues, which surpassed $1 billion. The Snapdragon 8 Elite Gen 5 mobile platform sets a new benchmark in mobile processors, and I remain bullish on its plans to design custom processors compatible with NVIDIA AI chips.

Qualcomm Fundamental Analysis Snapshot
The price-to-earnings (PE) ratio of 35.87 indicates QCOM remains undervalued for an AI stock. By comparison, the P/E ratio for the NASDAQ 100 is 39.05.
The average analyst price target for QCOM is $182.64. It shows negligible upside potential, but I expect upward revisions to follow its earnings beat, while downside risks are acceptable.
Qualcomm Technical Analysis
Today’s QCOM Signal

Qualcomm Price Chart
- The QCOM D1 chart shows price action inside a bullish price channel.
- It also shows price action between its ascending 0.0% and 38.2% Fibonacci Retracement Fan levels.
- The Bull Bear Power Indicator is bullish with an ascending trendline.
- The average bullish trading volumes are higher than the average bearish trading volumes.
- QCOM moved higher with the NASDAQ 100 Index, a significant bullish confirmation.
My Call on Qualcomm
Top Regulated Brokers
I am taking a long position in QCOM between $172.29 and $183.43. Diversification plans are ahead of schedule, led by the automotive sector, IoT-related business, and PCs. Operational metrics are excellent, and QCOM remains one of my preferred AI plays with comparably low valuations.
- QCOM Entry Level: Between $172.29 and $183.43
- QCOM Take Profit: Between $216.25 and $227.06
- QCOM Stop Loss: Between $153.35 and $160.31
- Risk/Reward Ratio: 2.32
Ready to trade our free stock signals? Here is our list of the top stock brokers worth checking out.
