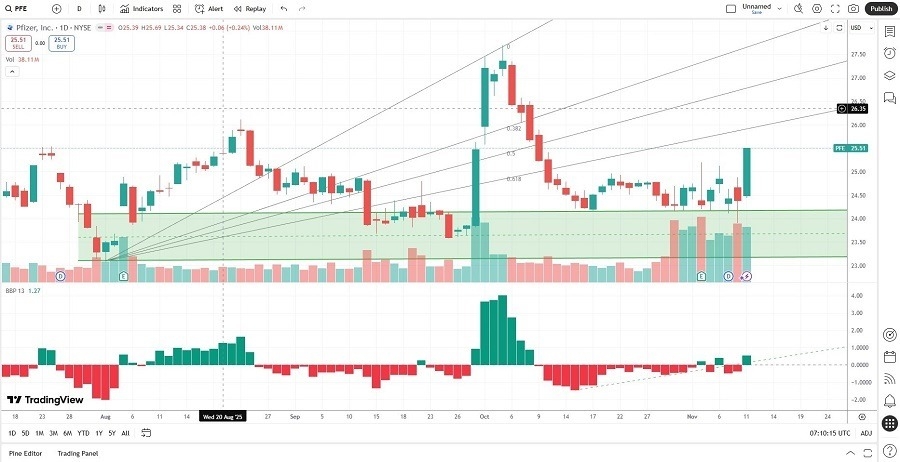
Long Trade Idea
Enter your long position between $24.89 (the intra-day high of its last bearish candlestick) and $25.63 (the intra-day high of a previous breakout candlestick).
Market Index Analysis
- Pfizer (PFE) is a member of the S&P 100 and the S&P 100 and the S&P 500 Index.
- Both indices ride the AI wave up and down, but bearish catalysts are strengthening.
- The Bull Bear Power Indicator of the S&P 500 turned bullish with a descending trendline.
Market Sentiment Analysis
Equity markets finished mixed yesterday, as investors rotated out of AI names, sending the NASDAQ lower, and rotating into defensive sectors, pushing the Dow Jones Industrial Average to fresh highs. Investors received a dismal ADP report, showing job losses in its latest survey. Optimism remains after the Senate passed a measure to reopen the government on Monday, with the House of Representatives likely to vote as soon as today. Earnings season is slowing, with Cisco, Disney, and Applied Materials among the highlights for the rest of the week.
Pfizer Fundamental Analysis
Pfizer is a multinational pharmaceutical and biotechnology company. It specializes in immunology, oncology, cardiology, endocrinology, and neurology. PFE also ranks fifth among the most prominent biomedical companies by revenue.
So, why am I bullish on PFE following its Metsera deal?
Pfizer reported revenues of $16.65 billion with earnings per share of $0.87, beating expectations of $16.58 billion and $0.63, respectively. It included a one-time $7.0 billion expense attributed to unusual items, and PFE raised its full-year EPS guidance. While the earnings report failed to move the share price, I am bullish on the $10 billion Metsera deal, as it unlocks future revenue in a high-growth market and diversifies its pipeline.

Pfizer Fundamental Analysis Snapshot
The price-to-earning (P/E) ratio of 14.83 makes PFE an inexpensive stock. By comparison, the P/E ratio for the S&P 500 Index is 30.65.
The average analyst price target for PFE is $29.04. It suggests moderate upside potential with limited downside risk.
Pfizer Technical Analysis
Today’s PFE Signal

Pfizer Price Chart
- The PFE D1 chart shows price action bouncing off its horizontal support zone.
- It also shows price action below its ascending Fibonacci Retracement Fan levels with rising bullish momentum.
- The Bull Bear Power Indicator turned bullish with an ascending trendline.
- The average bullish trading volumes are higher than the average bearish trading volumes.
- PFE corrected as the S&P 500 Index advanced, a bearish confirmation, but bullish catalysts have emerged.
My Call on Pfizer
I am taking a long position in PFE between $24.89 and $25.63. While the Metsera deal is a significant bullish catalyst, I am also bullish about returns on assets, equity, invested capital, and its healthy profit margins at low valuations. The excellent dividend yield is another bonus.
Top Regulated Brokers
- PFE Entry Level: Between $24.89 and $25.63
- PFE Take Profit: Between $31.35 and $32.29
- PFE Stop Loss: Between $21.97 and $22.81
- Risk/Reward Ratio: 2.21
Ready to trade our analysis of Pfizer? Here is our list of the top stock brokers worth reviewing.
