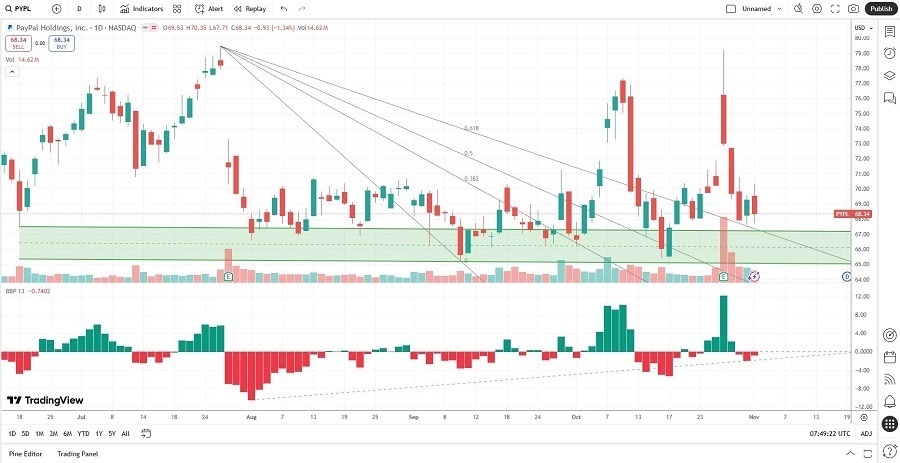
Long Trade Idea
Enter your long position between $67.52 (the upper band of its horizontal support zone) and $70.35 (yesterday’s intra-day high).
Market Index Analysis
- PayPal (PYPL) is a member of the NASDAQ 100, the S&P 100, and the S&P 500 indices.
- All three indices extend their record run, but bearish indicators continue to accumulate.
- The Bull Bear Power Indicator of the NASDAQ 100 is bullish with a rapid descent below its descending trendline.
Market Sentiment Analysis
Equity markets are pointing to a lower open this morning after a mixed session to start the new trading month. The AI sector was once again the driver of gains, as the bubble rages, but opinions on its duration differ. More FOMC members cautioned about the market’s perception that a December interest rate cut is guaranteed. Over 100 earnings reports are due this week, and AMD, SuperMicro, Uber, and Spotify are headlining today. The US government shutdown continues to delay core economic reports, including this week’s NFP report.
PayPal Fundamental Analysis
PayPal is a financial technology company focused on mobile and online payments. It added support for cryptocurrency purchases, operates in 202 markets, has 425M active accounts, and supports 25 fiat currencies.
So, why am I bullish on PYPL following its post-earnings slump?
While revenue of $7.85 billion was below estimates of $7.89 billion, earnings per share of $1.20 beat the $1.07 that analysts were looking for. Still, investors were hoping for stronger fourth-quarter guidance. I remain bullish on the back of PayPal Links, which will support cryptocurrency transactions. Recent partnerships with OpenAI, Alphabet, and Wix should boost revenues, and the first-ever dividend adds to a bullish outlook.

PayPal Fundamental Analysis Snapshot
The price-to-earnings (P/E) ratio of 13.72 makes PYPL an inexpensive stock. By comparison, the P/E ratio for the NASDAQ 100 is 39.70.
The average analyst price target for PYPL is $83.33. It suggests good upside potential with acceptable downside risks.
PayPal Technical Analysis
Today’s PYPL Signal

PayPal Price Chart
- The PYPL D1 chart shows price action above its horizontal support zone following a one-week sell-off.
- It also shows price action above its descending Fibonacci Retracement Fan.
- The Bull Bear Power Indicator is bearish with an ascending trendline, approaching a bullish crossover.
- The bearish trading volumes surged during the post-earnings sell-off, suggesting a potential washout.
- PYPL corrected as the NASDAQ 100 Index pushed higher, a bearish confirmation, but bullish catalysts are accumulating.
My Call on PayPal
I am taking a long position in PYPL between $67.52 and $70.35. The valuation of PYPL is a screaming buy, the dividend is a sign of optimism about future free cash flow, and its growing presence in AI and crypto commerce solutions is a core revenue driver.
- PYPL Entry Level: Between $67.52 and $70.35
- PYPL Take Profit: Between $79.50 and $83.33
- PYPL Stop Loss: Between $61.91 and $63.54
- Risk/Reward Ratio: 2.14
Ready to trade our free stock signals? Here is our list of the best stock brokers worth checking out.
