Oil stocks are publicly listed companies that operate in the oil and gas sector. The oil industry consists of the upstream, midstream, and downstream sectors. The upstream sector consists of the exploration and production of oil and gas. The midstream sector connects the upstream and downstream sectors via pipelines, tanks, terminals, and logistics. The downstream component refines, processes, and distributes finished oil and gas products.
The petrochemical sector is another critical component of oil stocks. Despite popular belief, many oil companies explore alternative energy solutions. They are active in natural gas and carbon capture. They have capital reserves, but oil and gas stocks must walk a fine line between maximizing existing infrastructure and transitioning to the future.
Top Regulated Brokers
Why Should You Consider Investing in Oil Stocks?
Leading oil stocks offer a consistent, stable dividend yield. Despite the green energy transition, oil and natural gas are critical to the global economy. The pivot towards oil, natural gas, and nuclear power for US energy security has opened the door to a renaissance in oil stocks, especially those with an attractive natural gas portfolio.
Here are a few things to consider when evaluating oil stocks:
- The oil sector lacks long-term visibility due to the volatility of oil prices, making a low-cost business model vital.
- Focus on oil stocks with a balanced combination of short-cycle and long-cycle investments.
- A well-diversified portfolio of oil and natural gas projects across global production hubs with excellent growth potential will ensure ongoing supply to meet surging demand.
- Invest in oil companies with healthy dividend yields to compensate your portfolio for the volatility in oil prices.
What are the Downsides of Oil Stocks?
The volatility of oil prices and the movement towards carbon-neutral, pose long-term risks beyond 2035. The outlook over the next five to ten years remains excellent.
Here is a shortlist of attractive oil stocks:
- ConocoPhillips (COP)
- Diamondback Energy (FANG)
- EOG Resources (EOG)
- Occidental Petroleum (OXY)
- Expand Energy Corporation (EXE)
- APA Corporation (APA)
- The Williams Companies (WMB)
- Northern Oil and Gas (NOG)
- Halliburton Company (HAL)
- MPLX LP (MPLX)
EOG Resources Fundamental Analysis
EOG Resources (EOG) is an energy company engaged in the exploration of hydrocarbons. It has over 98% of its operations and reserves in the US, followed by Trinidad and Tobago, and negligible reserves in Canada and China. EOG Resources is exploring oil fields in Oman and the UAE. It is also a member of the Russell 2000 and the S&P 500 indices.
So, why am I bullish on EOG ahead of its earnings release?
Shares are significantly undervalued, and I expect EOG Resources to beat revenue and earnings-per-share estimates, boosted by its Encino acquisition. I am bullish on the breakeven levels from oil production, which rank among the lowest in the energy sector, allowing EOG to perform well even with oil prices at current levels. I also look forward to upbeat guidance, and I am buying into the management team’s shareholder-first mentality.
Metric | Value | Verdict |
P/E Ratio | 10.23 | Bullish |
P/B Ratio | 2.06 | Bullish |
PEG Ratio | 7.14 | Bearish |
Current Ratio | 1.79 | Bearish |
Return on Assets | 12.38% | Bullish |
Return on Equity | 19.60% | Bullish |
Profit Margin | 25.22% | Bullish |
ROIC-WACC Ratio | Positive | Bullish |
Dividend Yield | 3.77% | Bullish |
EOG Resources Fundamental Analysis Snapshot
The price-to-earning (P/E) ratio of 10.23 makes EOG an inexpensive stock. By comparison, the P/E ratio for the S&P 500 Index is 30.97.
The average analyst price target for EOG Resources is $137.13. This suggests excellent upside potential with manageable downside risks.
EOG Resources Technical Analysis

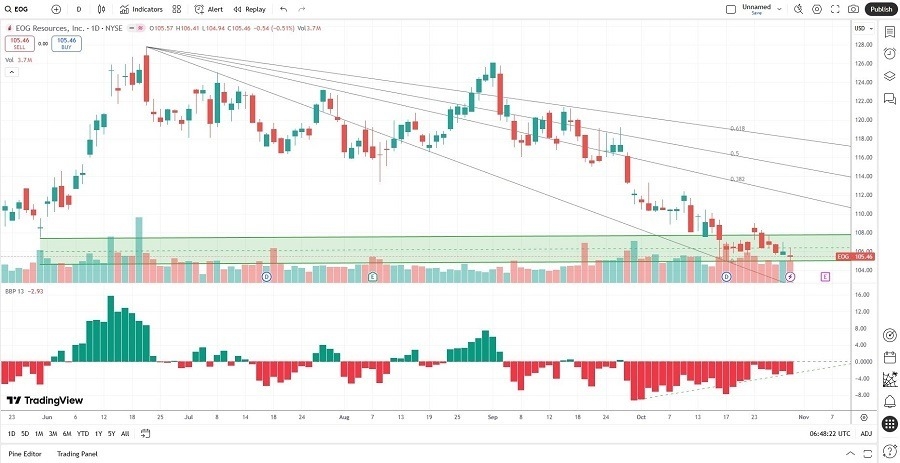
EOG Resources Price Chart
- The EOG D1 chart shows price action between its descending 0.0% and 38.2% Fibonacci Retracement Fan levels.
- It also shows EOG Resources inside a horizontal support zone.
- The Bull Bear Power Indicator is bearish, but a positive divergence has formed.
My Call on EOG Resources
I am taking a long position in EOG Resources between $104.94 and $109.00. EOG has deep roots in the Permian Basin, which continues to fuel energy companies, and I am bullish on its excellent reserves, advanced drilling technology, proprietary methods, and self-sourced materials.
Occidental Petroleum Fundamental Analysis
Occidental Petroleum (OXY) is a hydro exploration and petrochemical company and a component of the S&P 500. It is unafraid to acquire assets to ensure its market position and diversify its assets. OXY is also at the forefront of investing in the cleaner extraction of fossil fuels.
So, why am I bullish on OXY ahead of its earnings release?
With expectations for a 49% drop in earnings per share, I am looking for a beat, as sentiment surrounding Occidental Petroleum is too negative. I am equally bullish on the strong institutional backing, which holds approximately 50% of the shares, and on the $9.7 billion sale of its chemical unit, OXYChem, which significantly reduced net debt, positioning it for future growth and shareholder returns.
Metric | Value | Verdict |
P/E Ratio | 23.94 | Bullish |
P/B Ratio | 1.59 | Bullish |
PEG Ratio | 1.16 | Bullish |
Current Ratio | 1.05 | Bearish |
Return on Assets | 2.00% | Bearish |
Return on Equity | 4.72% | Bearish |
Profit Margin | 6.21% | Bearish |
ROIC-WACC Ratio | Positive | Bullish |
Dividend Yield | 2.24% | Bearish |
Occidental Petroleum Fundamental Analysis Snapshot
The price-to-earnings (P/E) ratio of 23.94 makes OXY an inexpensive stock. By comparison, the P/E ratio for the S&P 500 Index is 30.97.
The average analyst price target for OXY is $49.91. This suggests strong upside potential with reduced downside risk.
Occidental Petroleum Technical Analysis

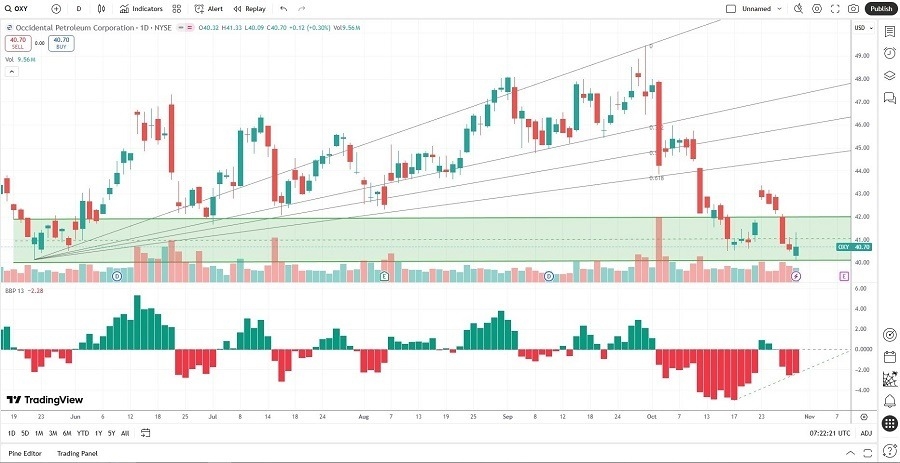
Occidental Petroleum Price Chart
- The OXY D1 chart shows price action below its ascending Fibonacci Retracement Fan.
- It also shows OXY inside a massive horizontal support zone.
- The Bull Bear Power Indicator is bearish, but a positive divergence began to form.
My Call on Occidental Petroleum
I am taking a long position in OXY between $40.09 and $41.89. OXY strives to improve its debt-heavy balance sheet and benefits from a well-diversified portfolio and a thriving midstream business. Sentiment is too bearish, and I am buying current support levels.
Ready to trade our free stock signals? Here is our list of the best stock brokers worth checking out.
