Short Trade Idea
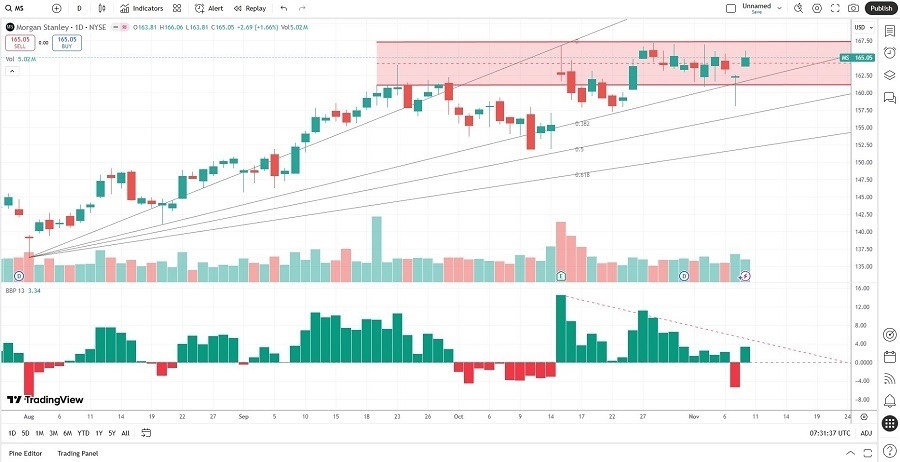
Enter your short position between $161.09 (the lower band of its horizontal resistance zone) and $167.13 (the upper band of its horizontal resistance zone).
Top Regulated Brokers
Market Index Analysis
- Morgan Stanley (MS) is a member of the S&P 100 and the S&P 500 Index.
- Both indices remain near all-time highs, but bearish factors are accumulating.
- The Bull Bear Power Indicator of the S&P 500 turned bullish with a descending trendline.
Market Sentiment Analysis
Equity markets rallied yesterday, building on Friday’s midday reversal. AI-related stocks led gains, recovering from last week’s heavy selling amid valuation concerns. The likely end of the government shutdown boosted sentiment after the Senate passed a bill to reopen it. Despite the risk-on sentiment, gold rallied amid President Trump’s tariff rebate proposal, which could amount to up to $2,000 per qualifying person in the form of tax breaks, and amid associated inflationary pressures. While AI darlings led the rally, earnings from Taiwan Semiconductor Manufacturing and CoreWeave show cracks in the bull case.
Morgan Stanley Fundamental Analysis
Morgan Stanley is an investment bank and financial services company with offices in 42 countries and over 80,000 employees. Its three business segments are Institutional Securities, Wealth Management, and Investment Management.
So, why am I bearish on MS after rallying over 20% from its August low?
The return on assets and the return on invested capital trail competitors, and the rising debt-to-asset ratio is alarming. Weak profit margins continue to contract, and the revenue growth rate is slowing. With equity markets at current valuations and the outlook dim, I expect the trend to continue and for Morgan Stanley to deliver a disappointing fourth-quarter performance.
Metric | Value | Verdict |
P/E Ratio | 16.93 | Bullish |
P/B Ratio | 2.62 | Bearish |
PEG Ratio | 1.34 | Bullish |
Current Ratio | 0.29 | Bearish |
ROIC-WACC Ratio | Negative | Bearish |
Morgan Stanley Fundamental Analysis Snapshot
The price-to-earnings (P/E) ratio of 16.93 makes MS a fairly valued bank stock. By comparison, the P/E ratio for the S&P 500 is 30.60.
The average analyst price target for MS is $168.15. It suggests negligible upside potential with excessive downside risks.
Morgan Stanley Technical Analysis
Today’s MS Signal

- The MS D1 chart shows price action inside a horizontal resistance zone.
- It also shows price action between its ascending 0.0% and 38.2% Fibonacci Retracement Fan levels.
- The Bull Bear Power Indicator turned bullish but remains below its descending trendline.
- The average bearish trading volumes are higher than the average bullish trading volumes since its earnings release.
- MS trended sideways as the S&P 500 Index is grinding higher, a bearish trading confirmation.
My Call on Morgan Stanley
I am taking a short position in MS between $161.09 and $167.13. With prices fairly valued based on the average analyst estimate and weak operational statistics, I see downside ahead for MS, driven by weak margins and declining revenue growth rates.
- MS Entry Level: Between $161.09 and $167.13
- MS Take Profit: Between $136.17 and $141.03
- MS Stop Loss: Between $173.20 and $176.66
- Risk/Reward Ratio: 2.06
Ready to trade our analysis of Morgan Stanley? Here is our list of the top stock brokers worth checking out.
