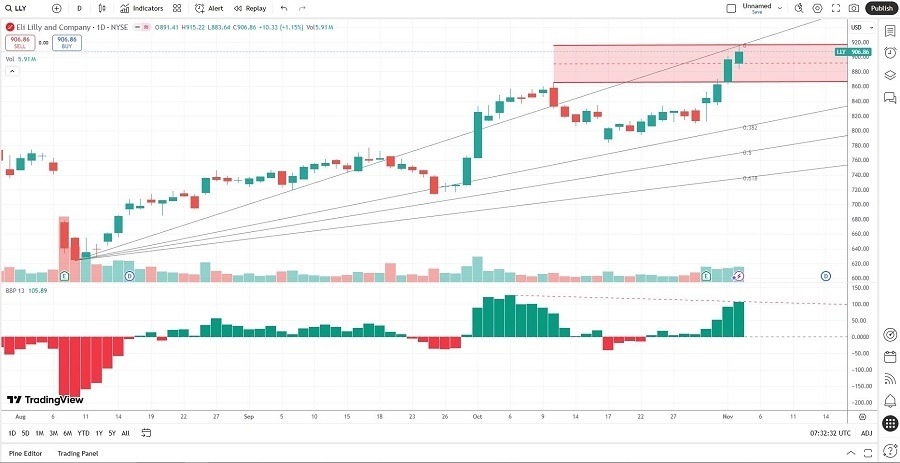
Short Trade Idea
Enter your short position between $864.35 (the lower band of its horizontal resistance zone) and $915.22 (the lower band of its horizontal resistance zone).
Market Index Analysis
- Eli Lilly and Company (LLY) is a member of the S&P 100 and the S&P 500 indices.
- Both indices remain near record highs, but bearish momentum is rising.
- The Bull Bear Power Indicator of the S&P 500 turned bearish after receding sessions with a descending trendline.
Market Sentiment Analysis
Equity markets dropped yesterday amid concerns about AI valuations and debt levels. AMD reported earnings after the bell that disappointed investors on margins, sending S&P 500 and NASDAQ 100 index futures lower this morning. Democrats won core races, where the New York mayoral elections might shake confidence. Toyota reported its second consecutive earnings miss, citing US tariffs, while markets await earnings reports from Qualcomm, McDonald’s, and Robinhood today. Investors will receive ADP payroll data today, along with updates on ISM services activity, but the most prolonged government shutdown in US history is delaying core reports.
Eli Lilly and Company Fundamental Analysis
Eli Lilly and Company is a pharmaceutical company with offices in 18 countries. ELY is the most valuable pharmaceutical company worldwide and the 11th-largest biomedical company by revenue.
So, why am I bearish on LLY despite its massive earnings beat?
Demand for its blockbuster weight-loss drug Zepbound and diabetes treatment Mounjaro allowed ELY to report a massive beat on revenue and earnings per share, with $17.60 billion in revenue and $7.02 in earnings per share. Analysts expected $16.01 billion in revenues with EPS of $5.69. ELY also raised its outlook, but I am bearish on the US government negotiating lower prices for Zepbound and on the disappointing results of its Phase 3 trials for its oral orforglipron treatment. Potential pharmaceutical tariffs present an additional headwind.

Eli Lilly and Company Fundamental Analysis Snapshot
The price-to-earnings (P/E) ratio of 44.45 makes LLY an expensive stock. By comparison, the P/E ratio for the S&P 500 index is 30.79.
The average analyst price target for LLY is $921.19. This suggests limited upside potential with rising downside risk.
Eli Lilly and Company Technical Analysis
Today’s LLY Signal

Eli Lilly and Company Price Chart
- The LLY D1 chart shows price action inside a horizontal resistance zone.
- It also shows price action breaking between its ascending 0.0% and 38.2% Fibonacci Retracement Fan level.
- The Bull Bear Power Indicator is bullish with a negative divergence.
- The average bullish trading volumes rose after its earnings report,but remain below previous rallies.
- LLY advanced with the S&P 500 index, a bullish confirmation, but bearish signals started to accumulate.
Top Regulated Brokers
My Call on Eli Lilly and Company
I am taking a short position in LLY between $864.35 and $915.22. Valuations are high, and sector tariffs, drug pricing, and disappointing Phase 3 results are raising concerns. I am also wary of rising debt levels and shrinking profit margins.
- LLY Entry Level: Between $864.35 and $915.22
- LLY Take Profit: Between $712.05 and $746.59
- LLY Stop Loss: Between $921.19 and $948.83
- Risk/Reward Ratio: 2.68
Ready to trade our daily stock signals? Here is our list of the best stock brokers worth reviewing.
