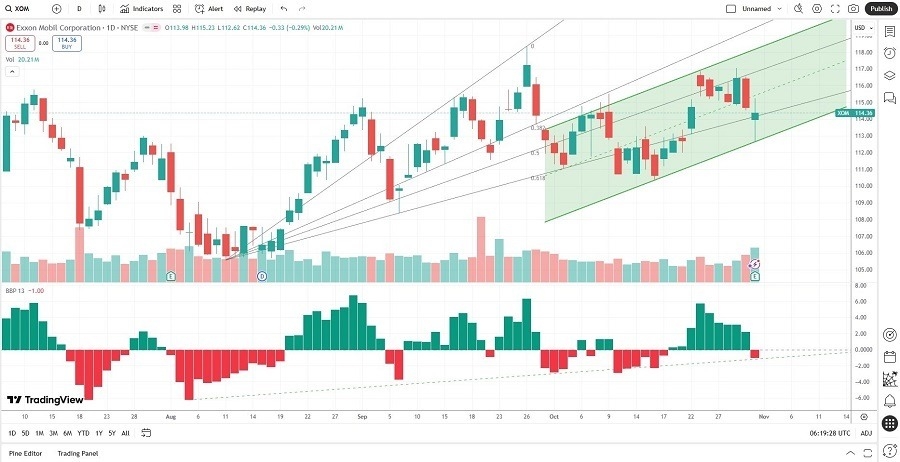
Long Trade Idea
Enter your long position between $112.62 (Friday’s intra-day low) and $115.23 (Friday’s intra-day high).
Top Regulated Brokers
Market Index Analysis
- Exxon Mobil (XOM) is a member of the S&P 100 and the S&P 500 indices.
- Both indices eek out fresh record highs, but bearish volumes have increased over the past four trading sessions.
- The Bull Bear Power Indicator of the S&P 500 is bullish with a rapid descent below its descending trendline.
Market Sentiment Analysis
Equity markets finished higher last week, but bearish volumes have increased. The Federal Reserve lowered interest rates by 25 basis points as expected. Still, Federal Reserve Chairman Powell cautioned that the December outlook remains uncertain and that further interest rate cuts are far from guaranteed amid fresh inflation worries. Optimism about thawing Sino-US relations and hopes that AI names like AMD and Palantir, which lead a busy earnings calendar this week, are driving futures higher in early morning off-hours trading.
Exxon Mobil Fundamental Analysis
Exxon Mobil is an oil and gas company, the seventh-largest US company by revenue, the thirteenth-largest globally, and the largest investor-owned oil company in the world.
So, why am I bullish on XOM after its earnings report?
Despite depressed oil prices, Exxon Mobil reported earnings of $7.5 billion, or $1.76 per share, and cash flow of $14.8 billion. I remain bullish on XOM due to its record-setting production in Guyana and the Permian Basin. Yellowtail, the fourth Guyana development, was delivered 4 months early and under budget, adding 700,000 barrels per day to production. The use of proprietary technologies boosted well recoveries by up to 20%, adding 1.7 million barrels to its Permian Basin production.
Metric | Value | Verdict |
P/E Ratio | 16.62 | Bullish |
P/B Ratio | 1.81 | Bullish |
PEG Ratio | 2.59 | Bearish |
Current Ratio | 1.25 | Bearish |
ROIC-WACC Ratio | Positive | Bullish |
Exxon Mobil Fundamental Analysis Snapshot
The price-to-earnings (P/E) ratio of 16.62 makes XOM an inexpensive stock. By comparison, the P/E ratio for the S&P 500 is 30.74.
The average analyst price target for XOM is $126.88, suggesting limited upside potential and fair downside risk, but I expect the share price to surge past that level.
Exxon Mobil Technical Analysis
Today’s XOM Signal

- The XOM D1 chart shows a price action inside a bullish price channel.
- It also shows price action moving back into its ascending Fibonacci Retracement Fan.
- The Bull Bear Power Indicator crossed over into bearish conditions but remains above its ascending trendline.
- The average bullish trading volumes are higher than the average bearish trading volumes.
- XOM stalled as the S&P 500 Index advanced, a bearish confirmation, but bullish catalysts have appeared.
My Call on Exxon Mobil
I am taking a long position in XOM between $112.62 and $115.23. I am bullish on Exxon Mobil, its Guyana and Permian Basin assets, and its proprietary drilling technology. XOM performed exceptionally well despite low oil prices, and I see more upside ahead.
- XOM Entry Level: Between $112.62 and $115.23
- XOM Take Profit: Between $126.88 and $133.22
- XOM Stop Loss: Between $105.53 and $107.77
- Risk/Reward Ratio: 2.01
Ready to trade our daily stock signals? Here is our list of the best stock brokers worth reviewing.
