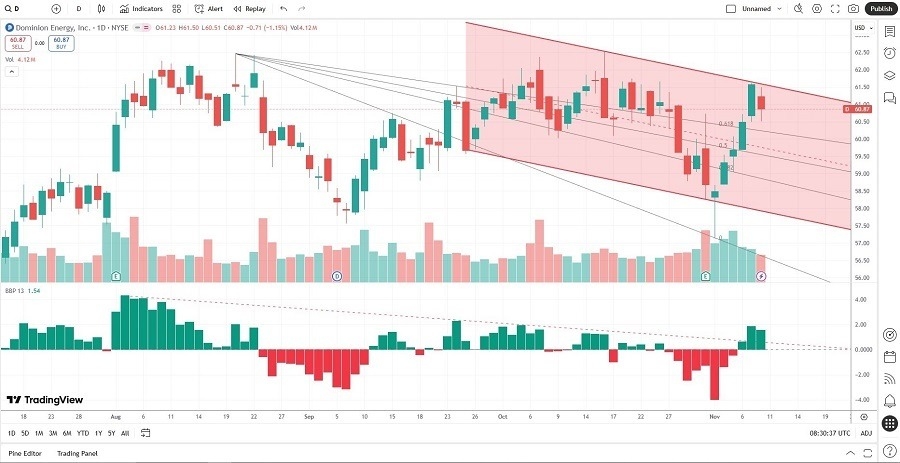
Short Trade Idea
Enter your short position between $60.51 (yesterday’s intra-day low) and $61.50 (yesterday’s intra-day high).
Top Regulated Brokers
Market Index Analysis
- Dominion Energy (D) is a member of the S&P 500 Index.
- This index remains near all-time highs, but bearish factors are accumulating.
- The Bull Bear Power Indicator of the S&P 500 Index turned bullish with a descending trendline.
Market Sentiment Analysis
Equity markets rallied yesterday, building on Friday’s midday reversal. AI-related stocks led gains, recovering from last week’s heavy selling amid valuation concerns. The likely end of the government shutdown boosted sentiment after the Senate passed a bill to reopen it. Despite the risk-on sentiment, gold rallied amid President Trump’s tariff rebate proposal, which could amount to up to $2,000 per qualifying person in the form of tax breaks, and amid associated inflationary pressures. While AI darlings led the rally, earnings from Taiwan Semiconductor Manufacturing and CoreWeave show cracks in the bull case.
Dominion Energy Fundamental Analysis
Dominion Energy (D) is an energy company that generates 23% of its energy from nuclear power, primarily at its North Anna and Surry Power Stations. It is also a core player in small modular reactors (SMRs) and the world’s biggest data center-serving electric utility.
So, why am I bearish on D after it beat its third-quarter earnings?
While sales clocked in at $4.53 billion with earnings per share of $1.06, Dominion Energy narrowed its full-year guidance. The return on assets is dismal, and depreciation, depletion, and amortization (DD&A), and financing costs, are high. Tariffs and US policy impacts have increased its CVOW project costs to $11.2 billion, and Dominion Energy could face delays into 2027 amid wind turbine issues.
Metric | Value | Verdict |
P/E Ratio | 19.89 | Bearish |
P/B Ratio | 1.95 | Bullish |
PEG Ratio | 2.11 | Bullish |
Current Ratio | 0.67 | Bearish |
ROIC-WACC Ratio | Negative | Bearish |
Dominion Energy Fundamental Analysis Snapshot
The price-to-earning (P/E) ratio of 19.89 makes D an expensive utility. By comparison, the P/E ratio for the S&P 500 Index is 30.60.
The average analyst price target for D is $64.13. It suggests negligible upside potential with rising downside risks.
Dominion Energy Technical Analysis
Today’s D Signal

- The D D1 chart shows price action inside a bearish price channel.
- It also shows price action breaking out above its Fibonacci Retracement Fan.
- The Bull Bear Power Indicator turned bullish but recorded a lower high.
- The average bullish trading volumes are decreasing during the post-earnings rally.
- D is trending lower as the S&P 500 is grinding higher, a bearish trading confirmation.
My Call oDominion Energy
I am taking a short position in D between $60.51 and $61.50. While its data center exposure is growing, AI is not the holy grail for addressing all issues, and cracks are appearing in that trend. Dominion Energy struggles with rising costs, delays, and debt. A decreasing dividend yield hints at cash flow issues, and shares remain fully valued.
- D Entry Level: Between $60.51 and $61.50
- D Take Profit: Between $52.53 and $53.36
- D Stop Loss: Between $64.13 and $66.05
- Risk/Reward Ratio: 2.20
Ready to trade our analysis of Dominion Energy? Here is our list of the top stock brokers worth checking out.
