Short Trade Idea
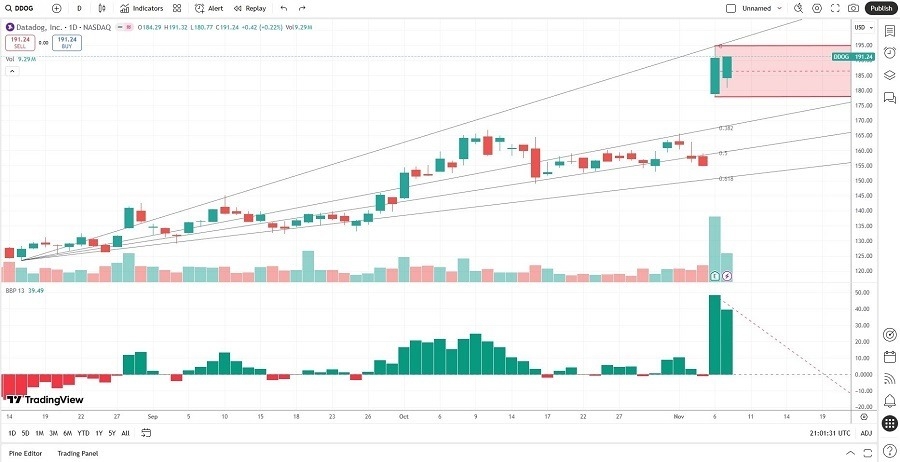
Enter your short position between $180.77 (Friday’s intra-day low) and $194.87 (the upper band of its horizontal resistance zone).
Market Index Analysis
- Datadog (DDOG) is a member of the NASDAQ 100 and the S&P 500 indices.
- Both indices retreated from record highs, and a bearish price channel is forming.
- The Bull Bear Power Indicator of the NASDAQ 100 index turned bearish with a descending trendline.
Market Sentiment Analysis
Equity futures point to a bullish start following Friday’s mid-session reversal, with beaten-down AI names leading the way. Hopes for an end to the longest shutdown in US history add to bullish sentiment. Consumer sentiment dropped to a three-year low, and markets await the release of core inflation reports that the government did not publish. Investors will receive more crucial earnings reports this week, led by CoreWeave, Oklo, Rocket Lab, The Walt Disney Company, and Paramount Skydance, but should brace for volatility ahead.
Datadog Fundamental Analysis
Datadog provides monitoring of servers, databases, tools, and services through a SaaS-based data analytics platform. It has embarked on a series of smaller acquisitions to boost its services portfolio. It uses both open and closed-source technologies.
So, why am I bearish on DDOG despite its encouraging earnings report?
While Datadog reported a 28.4% surge in net revenue year over year to $885.7 million, a 19.6% rise in earnings per share to $0.55, and raised its 2025 revenue guidance from $3.32 billion to $3.39 billion, the market’s overreaction was massive. I appreciate the efforts to diversify away from OpenAI, but the current share price fully reflects all positive developments, valuations are excessive, and DDOG is prone to downside risks. I caution against buying companies that depend on a single client for the bulk of their revenue.

Datadog Fundamental Analysis Snapshot
The price-to-earning (P/E) ratio of 616.90 makes DDOG an unacceptably expensive stock. By comparison, the P/E ratio for the NASDAQ 100 is 36.43.
The average analyst price target for DDOG is $198.31. It suggests limited upside potential with excessive downside risks.
Datadog Technical Analysis
Today’s DDOG Signal

Datadog Price Chart
- The DDOG D1 chart shows price action inside its horizontal resistance zone.
- It also shows price action between its ascending 0.0% and 38.2% Fibonacci Retracement Fan levels.
- The Bull Bear Power Indicator is bullish with a descending trendline.
- The average bearish trading volumes are higher than the average bullish trading volumes, except for the two-day post-earnings breakout.
- DDOG surged as the S&P 500 index retreated, a significant bullish trading signal, but bearish catalysts outweigh it.
Top Regulated Brokers
My Call on Datadog
I am taking a short position in DDOG between $180.77 and $194.87. The current valuations remain disconnected from reality, and the minor upgrade to its full-year guidance does not justify the market overreaction. I see more risks ahead, ranging from valuations to revenues.
- DDOG Entry Level: Between $180.77 and $194.87
- DDOG Take Profit: Between $133.14 and $145.16
- DDOG Stop Loss: Between $200.72 and $204.73
- Risk/Reward Ratio: 2.39
Ready to trade our analysis of Datadog? Here’s our list of the best MT4 crypto brokers worth reviewing.
