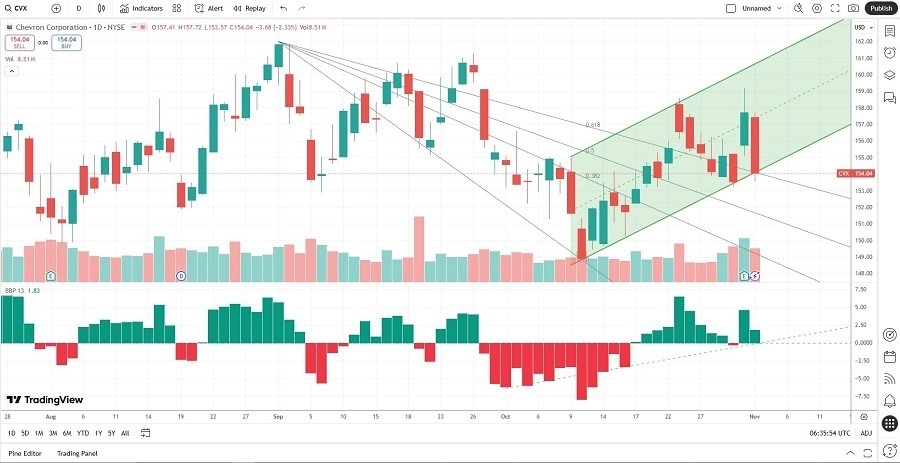
Long Trade Idea
Enter your long position between $153.57 (yesterday’s intra-day low) and $155.11 (the intra-day low of its last bullish candlestick).
Market Index Analysis
- The Chevron (CVX) is a member of the Dow Jones Industrial Average, the S&P 100, and the S&P 500 indices.
- All three indices extend their record run, but bearish indicators continue to accumulate.
- The Bull Bear Power Indicator of the S&P 500 is bullish with a rapid descent below its descending trendline.
Market Sentiment Analysis
Equity markets are pointing to a lower open this morning after a mixed session to start the new trading month. The AI sector was once again the driver of gains, as the bubble rages, but opinions on its duration differ. More FOMC members cautioned about the market’s perception that a December interest rate cut is guaranteed. Over 100 earnings reports are due this week, and AMD, SuperMicro, Uber, and Spotify are headlining today. The US government shutdown continues to delay core economic reports, including this week’s NFP report.
Chevron Fundamental Analysis
Chevron is an oil and gas company active in over 180 countries. It is a vertical integrated company active in exploration, production, refining, marketing, transport, petrochemicals, and power generation.
So, why am I bullish on CVX after its earnings report?
Average oil prices were $10 lower in the third quarter compared to last year, but Chevron reported revenue of $49.73 or $1.82 per share on the back of record daily production of 4.1 million barrels per day, beating on both metrics. The headaches of the Hess acquisition, which added US shale and oil-rich Guyana production to its well-diversified portfolio. Adjusted free cash flow surged by more than 50%, and I remain bullish on CVX, its dividend, and buybacks.

Chevron Fundamental Analysis Snapshot
The price-to-earnings (P/E) ratio of 21.67 makes CVX an inexpensive stock. By comparison, the P/E ratio for the S&P 500 Index is 30.74.
The average analyst price target for CVX is $172.04, suggesting good upside potential with acceptable downside risk.
Chevron Technical Analysis
Today’s CVX Signal

Chevron Price Chart
- The CVX D1 chart shows a price action inside a bullish price channel.
- It also shows price action breaking out above its ascending Fibonacci Retracement Fan.
- The Bull Bear Power Indicator is bullish with an ascending trendline.
- The average bullish trading volumes are higher than the average bearish trading volumes.
- CVX failed to match the record run of the S&P 500 Index, a bearish confirmation, but it amassed bullish trading signals.
My Call on Chevron
I am taking a long position in CVX between $153.57 and $155.11. The Hess acquisition boosted Chevron’s production portfolio, and I am bullish on its healthy dividend yield, which is likely to increase further, and on its ability to generate free cash flow despite lower oil prices.
- CVX Entry Level: Between $153.57 and $155.11
- CVX Take Profit: Between $172.04 and 4180.64
- CVX Stop Loss: Between $146.53 and $148.89
- Risk/Reward Ratio: 2.62
Ready to trade our free stock signals? Here is our list of the best stock brokers worth checking out.
