Bearish view
- Sell the BTC/USD pair and set a take-profit at 95,000.
- Add a stop-loss at 105,000.
- Timeline: 1-2 days.
Bullish view
- Buy the BTC/USD pair and set a take-profit at 105,000.
- Add a stop-loss at 95,000.

Bitcoin price remained under pressure as investors sold and a sense of fear spread in the market. The BTC/USD pair moved below the important support at 100,000 for the first time since June. It has now fallen by 20% from its highest point this year.
Bitcoin’s crash coincided with the retreat of the stock market, with the Nasdaq 100, Dow Jones, and Nasdaq 100 indices falling by over 1% in their worst day in over a month.
The stock market dropped after the heads of Goldman Sachs and Morgan Stanley warned of a potential pullback after the recent rally. It also dropped after Michael Burry, a popular investor, said that he was short popular AI companies like Nvidia and Palantir.
Top Regulated Brokers
The BTC/USD pair also jumped because of the ongoing US dollar rebound after the relatively hawkish Federal Reserve. In its statement, the bank hinted that a rate cut in December was not guaranteed as some analysts were expecting.
The Fed is concerned by the labor market and inflation, which has remained above the target in the last four years. Officials believe that more rate cuts will help to stimulate inflation.
Bitcoin price has also retreated as demand from American investors retreated. Data shows that spot Bitcoin ETFs have shed over $200 million this week so for, after shedding over $798 million in the previous week.
The crypto market is also struggling because of the recent liquidation event that cost investors over $20 billion within a day. That liquidation has pushed more people to the sidelines as the Crypto Fear and Greed Index has dropped to the fear zone of 25.
BTC/USD Technical Analysis
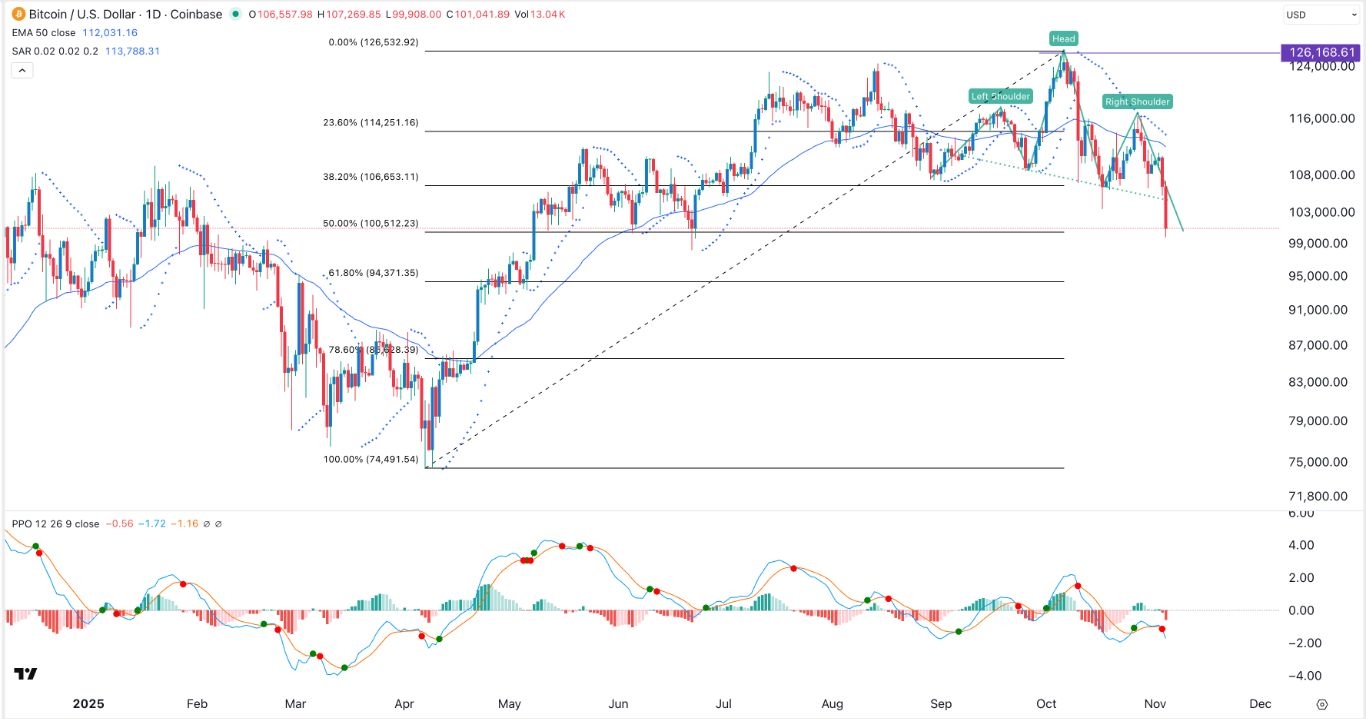
The daily timeframe chart shows that the BTC/USD pair has crashed from a high of 126,168 in October to 101,200 today.
It has moved to the 50%Fibonacci Retracement level, a sign that the downtrend is gaining momentum. The pair also dropped below the 50-day moving average and the Parabolic SAR indicator.
The BTC/USD pair has also formed a death cross as the 50-day and 200-day Weighted Moving Averages (WMA) have formed a bearish crossover. It also formed a head-and-shoulders pattern on the daily chart.
Therefore, the most likely scenario is where the pair continues falling as sellers target the 61.8% retracement level at 94,370. However, it may attempt to bounce back, which will be a bull trap or a dead-cat bounce.
Ready to trade our daily Forex signals? Here’s a list of some of the best crypto brokers to check out.
