Short Trade Idea
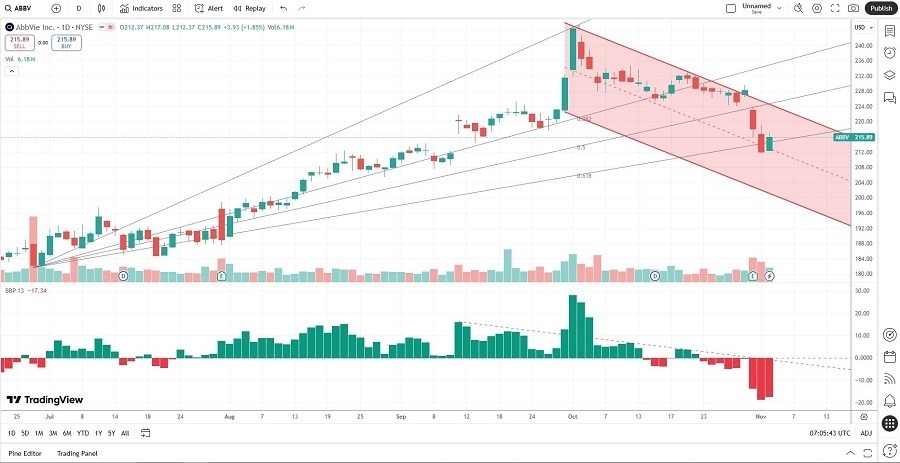
Enter your short position between $211.69 (the intra-day low of its last bearish candlestick) and $217.08 (yesterday’s intra-day high).
Market Index Analysis
- AbbVie (ABBV) is a member of the S&P 100 and the S&P 500 indices.
- Both indices remain near record highs, but bearish momentum is rising.
- The Bull Bear Power Indicator of the S&P 500 index turned bearish after receding sessions with a descending trendline.
Market Sentiment Analysis
Equity markets dropped yesterday amid concerns about AI valuations and debt levels. AMD reported earnings after the bell that disappointed investors on margins, sending S&P 500 and NASDAQ 100 futures lower this morning. Democrats won core races, where the New York mayoral elections might shake confidence. Toyota reported its second consecutive earnings miss, citing US tariffs, while markets await earnings reports from Qualcomm, McDonald’s, and Robinhood today. Investors will receive ADP payroll data today, along with updates on ISM services activity, but the most prolonged government shutdown in US history is delaying core reports.
AbbVie Fundamental Analysis
AbbVie is a pharmaceutical company ranked seventh among the largest by revenue, with a growing neuroscience presence bolstered by a robust product portfolio.
So, why am I bearish on ABBV after its earnings release?
Third-quarter revenues rose to $15.78 billion with earnings per share of $1.86, both beating analyst expectations. Still, operating margins plunged to 12.1% from 26.5% one year ago, and the management team slashed the full-year earnings-per-share guidance by 11.3%. Valuations remain excessive, and AbbVie faces headwinds in its aesthetic division. The revenue growth rate is slowing, and I expect the negative EPS growth rate to continue.

AbbVie Fundamental Analysis Snapshot
The price-to-earnings (P/E) ratio of 163.55 makes ABBV an expensive stock. By comparison, the P/E ratio for the S&P 500 is 30.79.
The average analyst price target for ABBV is $240.39. This points to moderate upside potential, but also to rising downside risk.
AbbVie Technical Analysis
Today’s ABBV Signal

AbbVie Price Chart
- The ABBV D1 chart shows price action inside a bearish price channel.
- It also shows price action breaking down below its Fibonacci Retracement Fan.
- The Bull Bear Power Indicator is bearish with a descending trendline.
- The average bearish trading volumes are higher than the average bullish trading volumes.
- ABBV corrected as the S&P 500 set fresh records, a significant bearish trading signal.
My Call on AbbVie
Top Regulated Brokers
I am taking a short position in ABBV between $211.69 and $217.08. The plunge in profit margins and the double-digit decrease in its full-year earnings-per-share guidance raise red flags. I expect headwinds to put downside pressure on the current quarter.
- ABBV Entry Level: Between $211.69 and $217.08
- ABBV Take Profit: Between $181.73 and $187.62
- ABBV Stop Loss: Between $224.04 and $232.81
- Risk/Reward Ratio: 2.43
Ready to trade our daily stock signals? Here is our list of the best stock brokers worth reviewing.
