
Last week maintained the dominant trends seen in recent weeks, with major US stock market indices and precious metals breaking to new record or long-term high prices.
Fundamental Analysis & Market Sentiment
I wrote on the 28th September that the best trades for the week would be:
- Long of the S&P 500 Index after a daily (New York) close above 6,703. This set up at Wednesday’s close, and over the remainder of the week, the price rose by 0.09%.
- Long of the NASDAQ 100 Index after a daily (New York) close above 24,794. This set up at Wednesday’s close, and over the remainder of the week, the price fell by 0.10%.
- Long of Gold following a New York close above $3,800. This set up at Monday’s close, and over the remainder of the week, the price rose by 1.37%.
- Long of Silver. Silver rose by 3.87% over the week.
These trades produced an overall gain of 5.23%, equal to 1.31% per asset.
A summary of last week’s most important data (some US releases were postponed due to the government shutdown in the USA):
- US JOLTS Job Openings – this was a little stronger than expected, suggesting the US economy may be slowing down a little less than was thought.
- US ISM Services PMI – slightly worse than expected.
- US ISM Manufacturing PMI – as expected.
- Reserve Bank of Australia Cash Rate & Rate Statement – the RBA left its Official Cash Rate on hold at 3.60% as expected, was slightly hawkish in its rhetoric.
- Swiss CPI (inflation) – contracted by 0.2% month-on-month, as expected.
- Chinese Manufacturing PMI – this was approximately as expected.
It was a relatively quiet week in the market, especially concerning themes and perceptions. There is little to say. The US government went into one of its periodic shutdown caused by political deadlock, but these shutdowns have become normalized in recent years and rarely cause much in the markets.
Bullishness remains solid in stock markets, especially in the USA, with major stock indices there continuing to rise to new highs. Precious metals have also been rising strongly, in the case of Gold, to new all-time high prices. The Forex market remains relatively quiet.
This is likely to be a good time to trade or invest, with Silver really taking off, while Gold and major US stock market indices continue to break to new record high prices.
Top Regulated Brokers
The Week Ahead: 6th– 10th October
The coming week might see more activity in the market, as we have US non-farm payrolls data due which could impact perceptions of where the US economy is headed over the near term. There is also key average hourly earnings due, as well as FOMC minutes and a central bank meeting in New Zealand.
This week’s most important data points, in order of likely importance, are:
- US Average Hourly Earnings
- US Non-Farm Employment Change
- US Preliminary UoM Inflation Expectations
- US Preliminary UoM Consumer Sentiment
- FOMC Meeting Minutes
- Reserve Bank of New Zealand Policy Meeting
- US Unemployment Claims
- Canadian Employment Change
- Canadian Unemployment Rate
It is a public holiday in China on Monday and Tuesday.
Australia moves to daylight savings time at the start of this week.
Monthly Forecast October 2025
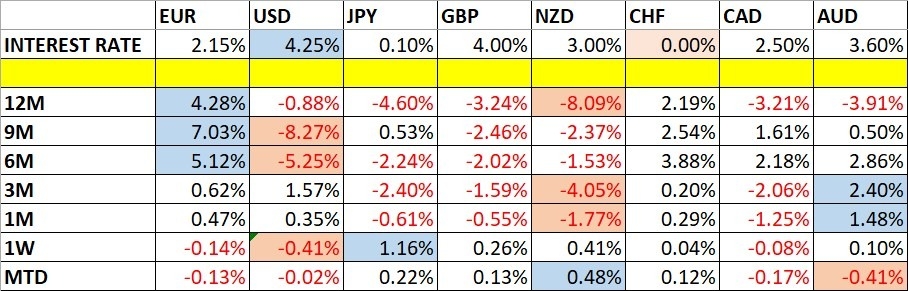
Currency Price Changes and Interest Rates
For the month of October 2025, I forecast that the EUR/USD currency pair will rise in value.
Weekly Forecast 5th October 2025
I made no weekly forecast last week.
There were no unusually large price movements in currency crosses last week, so I have no weekly forecast this week.
The Japanese Yen was the strongest major currency last week, while the US Dollar was the weakest. Volatility was unchanged compared to last week, with again only 15% of major pairs and crosses changing in value by more than 1%.
Next week’s volatility is likely to increase.
You can trade these forecasts in a real or demo Forex brokerage account.
Technical Analysis
Key Support/Resistance Levels for Popular Pairs
Currency Pair | Key Support / Resistance Levels |
AUD/USD | Support: 0.6584, 0.6572, 0.6559, 0.6552Resistance: 0.6613, 0.6659, 0.6696, 0.6720 |
EUR/USD | Support: 1.1728, 1.1682, 1.1602, 1.1515Resistance: 1.1768, 1.1789, 1.1821, 1.1844 |
GBP/USD | Support: 1.3467, 1.3448, 1.3413, 1.3386Resistance: 1.3534, 1.3561, 1.3587, 1.3656 |
USD/JPY | Support: 146.68, 146.11, 145.14, 144.96Resistance: 147.79, 148.47, 149.60, 150.01 |
AUD/JPY | Support: 97.14, 96.80, 96.68, 96.30Resistance: 97.50, 97.63, 98.22, 98.81 |
EUR/JPY | Support: 172.81, 172.26, 171.99, 171.57Resistance: 173.46, 173.98, 174.61, 174.75 |
USD/CAD | Support: 1.3935, 1.3903, 1.3879, 1.3864Resistance: 1.3959, 1.4012, 1.4055, 1.4131 |
USD/CHF | Support 0.7932, 0.7878, 0.7800, 0.7700Resistance: 0.7971, 0.8008, 0.8039, 0.8049 |
Key Support and Resistance Levels
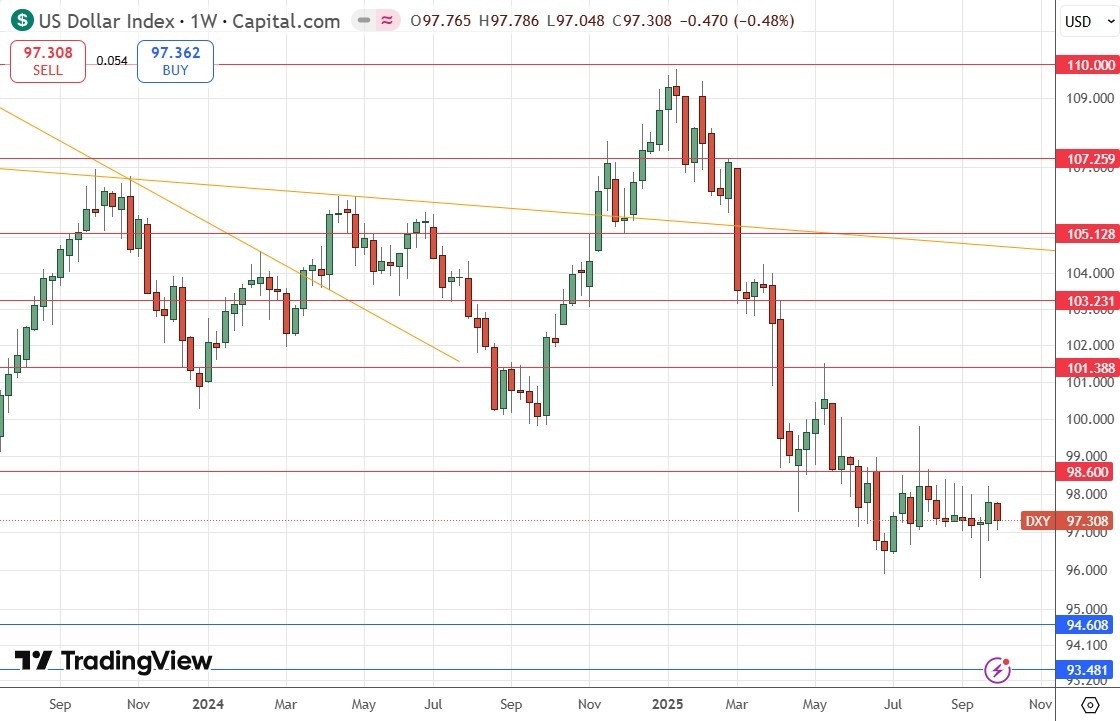
US Dollar Index
Last week, the US Dollar Index printed a bearish inside candlestick following on from the previous week’s bullish pin bar continuation. However, the candlestick is not very bearish as it has a significant lower wick and the price action is clearly within a consolidation zone. Despite being below its level of 26 weeks ago, the price is above where it was 13 weeks ago, so by my preferred metric, I can declare the long-term bearish trend is over. This places the US Dollar in an interesting position.
There is more consensus now in the market about the Fed’s path of rate cuts over the rest of 2025 and 2026, and I think this means the current consolidation in the greenback is likely to continue over the near term. So, I am neutral on the Dollar, and think trades should be taken over the coming week on the merits of other assets but not the Dollar.
US Dollar Index Weekly Price Chart
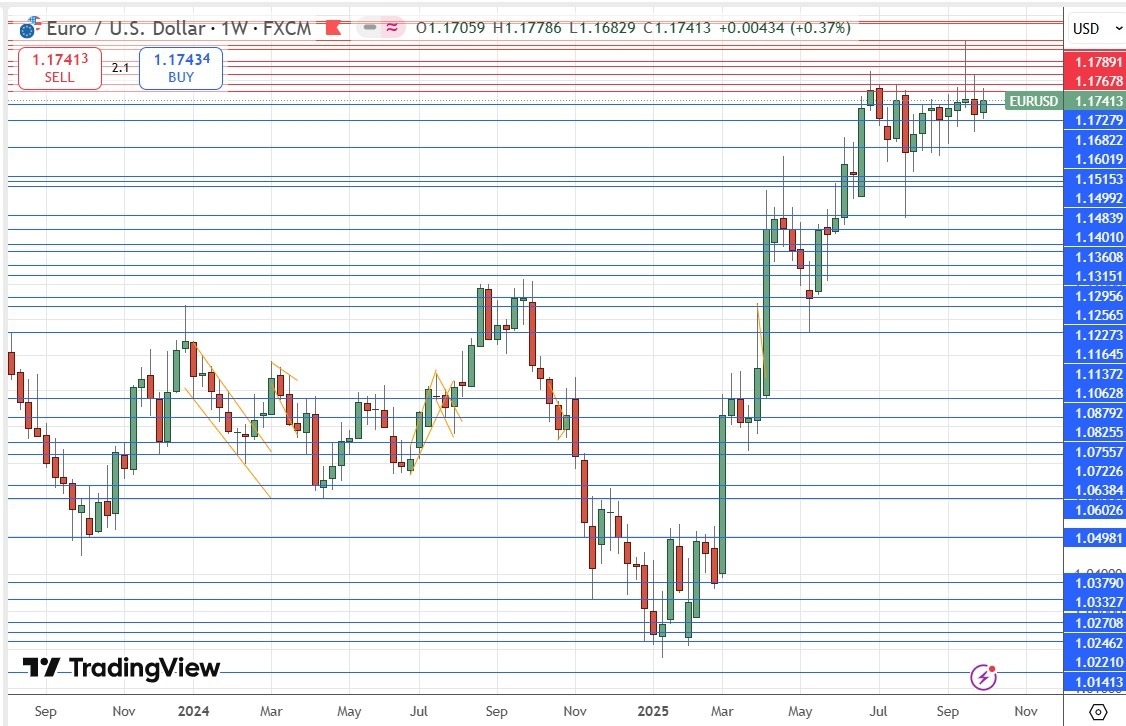
EUR/USD
The EUR/USD currency pair rose very weakly last week by printing a bullish inside candlestick, although like DXY considered above, it has a significant wick against this move. It is worth noting that there is a bullish long-term trend which is still valid. The Euro is also showing some relative strength lately, rising to new long-term highs against several other currencies beyond the US Dollar.
Bulls should be worried that the bearish pin bar couple of weeks ago rejected a new 4-year high just above a consolidation zone just after the initial breakout. The price is struggling to regain its recent highs above $1.1800.
Despite these cautionary factors, I remain long of this currency pair as this currency pair historically tends to respect its long-term trends very well, and I see a potential new long trade entry if get a daily (New York) close above $1.1867. However, if you are going to buy on the dips, the support levels at $1.1728 and $1.1682 look like attractive areas to spot bullish bounces.
EUR/USD Weekly Price Chart
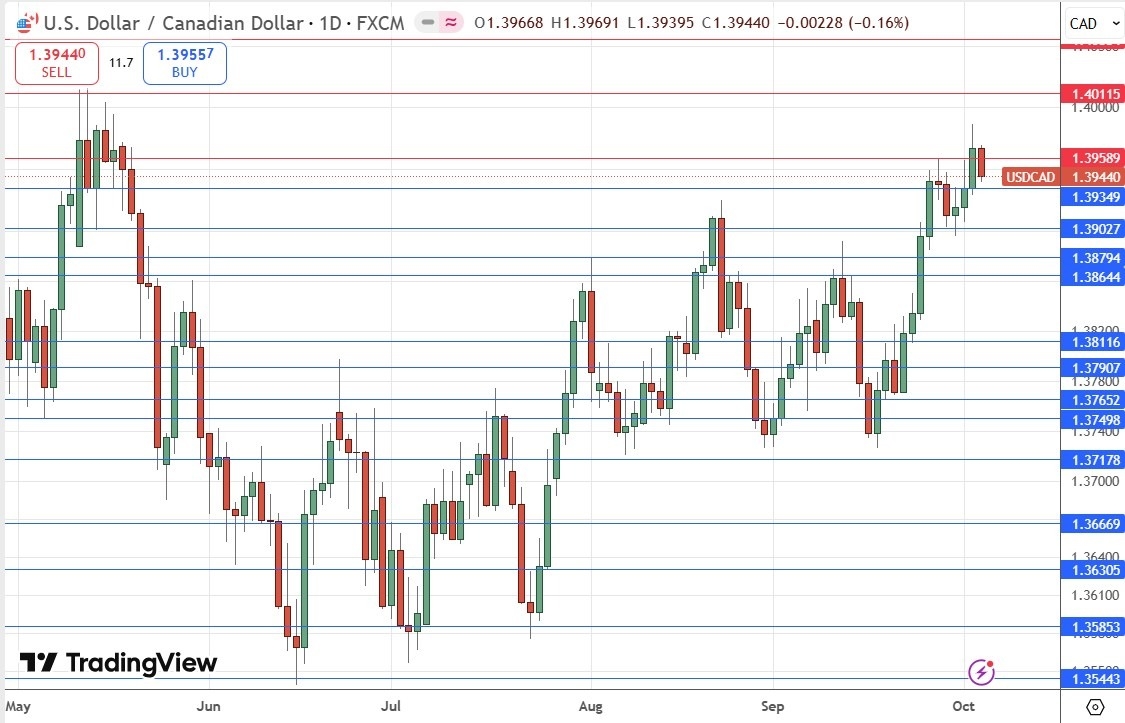
USD/CAD
The USD/CAD currency pair daily chart shows a higher low, and notably, both the two lows are also triple bottoms when you drill into the daily chart! This could be seen as a bullish price action signal, worthy of entering a long trade. However, there is a confluence of a big round number not far above, at $1.4000, and a key resistance level just above it, could still stop a meaningful advance here.
If you are looking for a long trade on the recent pullback at the end of last week, bullish bounces at $1.3935 or $1.3903.
USD/CAD Dailly Price Chart
S&P 500 Index
The S&P 500 Index printed a bullish candlestick candlestick last week, which reached and closed at yet another all-time high. The price is trading in blue sky and it could only be more bullish if the price had closed right on the high. However, Friday did see the Index give up some of its recent gains.
US stock markets are rising strongly although many analysts see the market as hugely overvalued. I put the continued advance to new highs down to the Trump effect as people believe President Trump will do anything to boost the market.
The index has risen by about 15% since the start of 2025 with the rise really happening in the aftermath of the Trump tariff panic. It is an open question how much further the current bull run will go, but betting against new record highs in the US stock market is a brave and probably foolish move, unless it’s a cautious play in individual underperforming stocks.
I remain bullish on the S&P 500 Index and see it as an unequivocal buy.
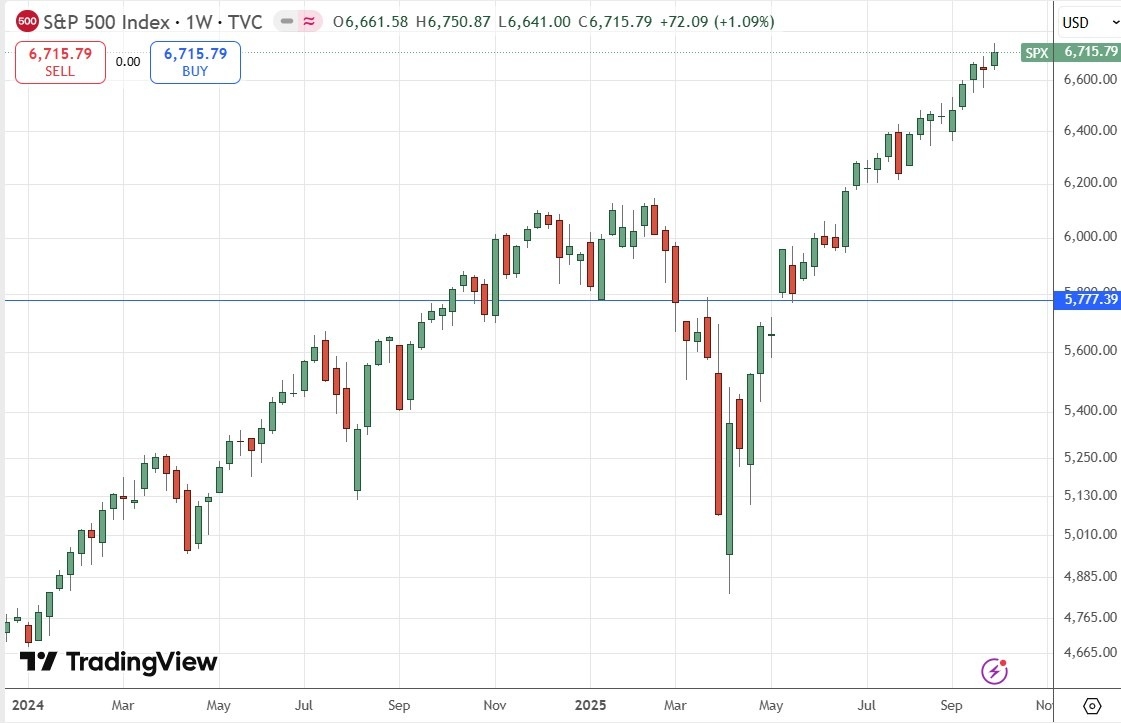
S&P 500 Index Weekly Price Chart
NASDAQ 100 Index
Everything I wrote above about the S&P 500 Index also applies to the NASDAQ 100 Index, except the NASDAQ 100 Index has risen by 18%, more than the S&P’s 2025 to date increase of 15%.
I remain bullish on the NASDAQ 100 Index and see it as an unequivocal buy.
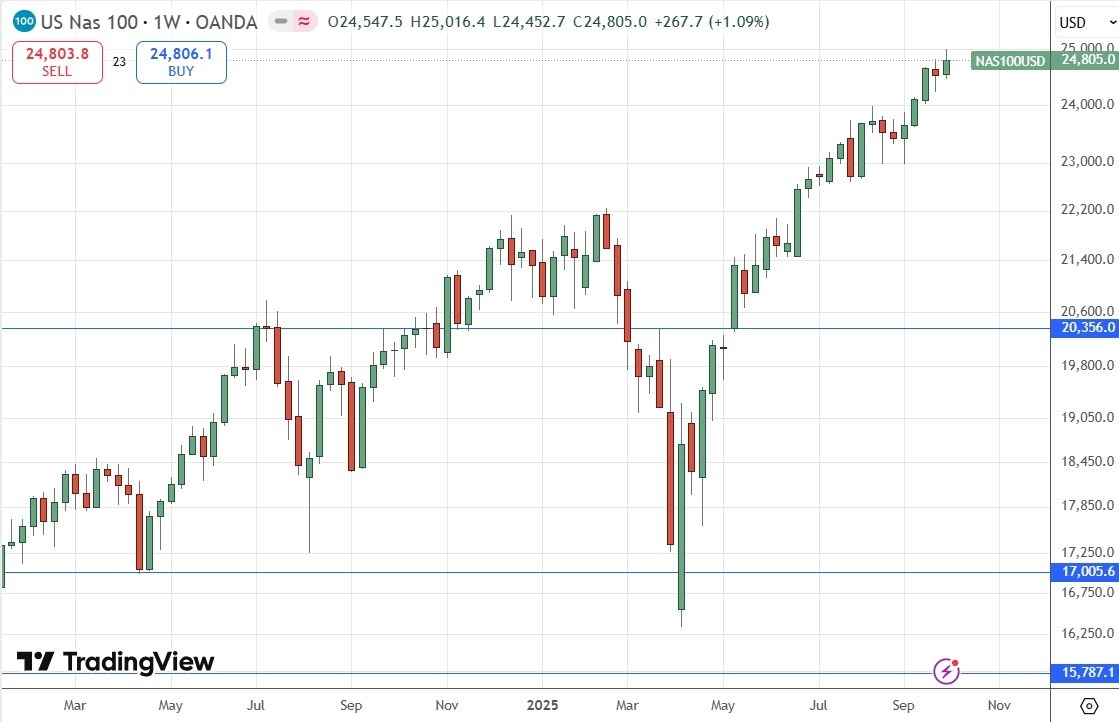
NASDAQ 100 Index Weekly Price Chart
XAG/USD
Silver had yet another great week, showing yet another outsize rise in value of almost 4%, and powering up to a new 14-year high which is now very close to the all-time high made in 2011. It also outperformed Gold and all other precious metals. These are bullish signs, as is the breakout from the linear regression analysis shown within the price chart below – the price is well above the upper bound.
With Silver’s outperformance against Gold, it is probably worth being bold on the long side here.
Having said, if you are just entering a new long trade here, as the move is quite extended, a smaller position size might be wise. Volatility is high, so a strong downwards movement is possible when the retracement finally comes.
I remain very bullish on Silver but worry that it may have peaked on such a large move. Trading the trend with a trailing stop is a good answer to this dilemma if you do it systematically. There could well be profit taking at $50, especially if Gold reaches $4,000 systematically.
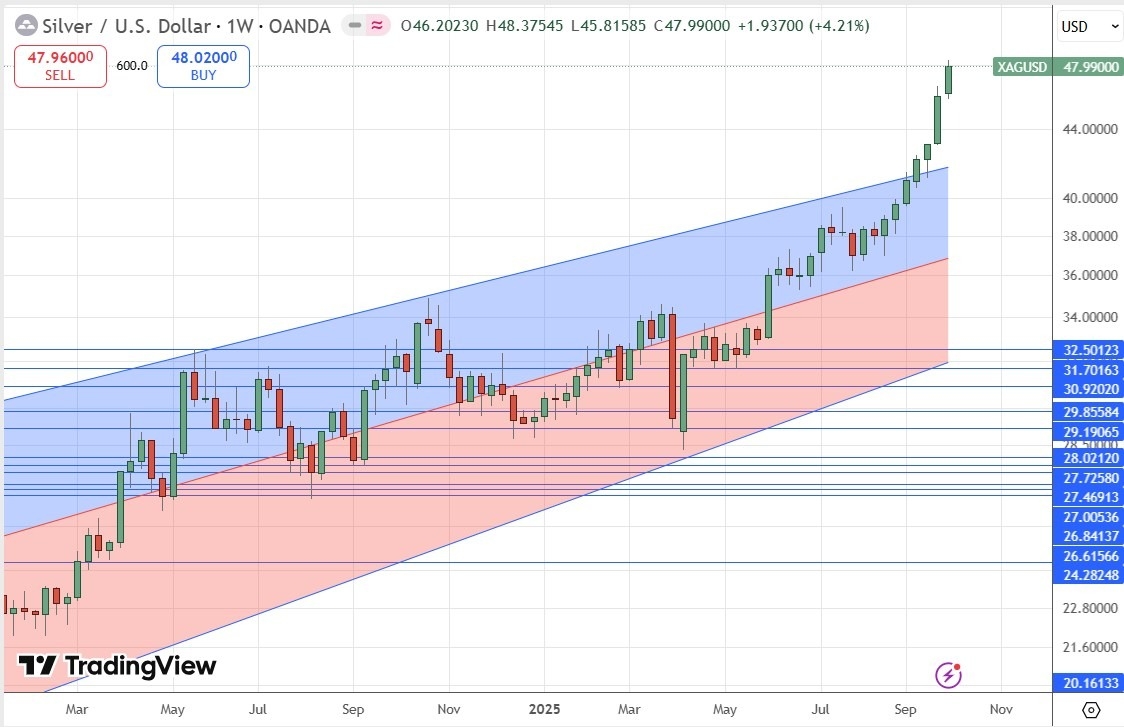
XAG/USD Weekly Price Chart
XAU/USD
Gold rose last week to rise to print a new all-time high, but closed a bit below that high and the round number at $4,000. It is worth noting that Gold underperformed Silver last week, but not by a lot
The long-term bullish trend and break to new record highs are bullish factors, as is the strong US stock market, as the US stock market has tended to be positively correlated with Gold, to the surprise of many who see it as a hedge against inflation.
For anyone who is only entering a long trade now, it might be wise to use a smaller position size to account for any sudden high-volatility snapback towards lower prices. Just like the stock market, you have to wonder how much further this bull run will last – but it is backed by a very strong long-term bullish trend, and you trade against that at your peril unless you start to see clear signs of a reversal in the price action – which is not showing here yet.
There could well be profit taking at $4,000, especially if Silver reaches $50 simultaneously.
I am bullish on Gold, but it might be wise to take a smaller long position here than with Silver, which looks more bullish.
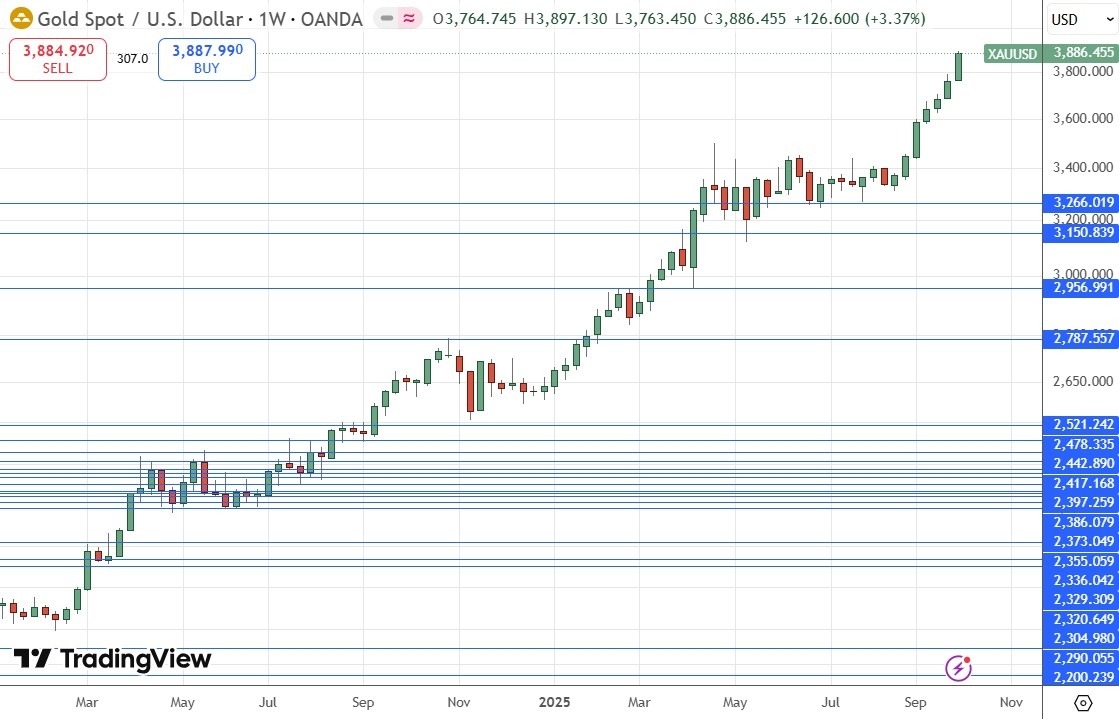
XAU/USD Weekly Price Chart
Bottom Line
I see the best trades this week as:
- Long of the S&P 500 Index.
- Long of the NASDAQ 100 Index.
- Long of Silver.
- Long of Gold.
Ready to trade our Forex weekly forecast? Check out our list of the top 100 Forex brokers.