Fundamental Analysis & Market Sentiment
I wrote on the 5th October that the best trades for the week would be:
- Long of the S&P 500 Index. This fell by 2.69% over the week.
- Long of the NASDAQ 100 Index. This fell by 3.06% over the week.
- Long of Gold. This rose by 3.22% over the week.
- Long of Silver. This rose by 4.54% over the week.
These trades produced an overall gain of 2.01%, equal to 0.50% per asset.
A summary of last week’s most important data (some US releases were postponed due to the ongoing government shutdown in the USA):
- US Preliminary UoM Inflation Expectations – this came in at 4.6%, slightly lower than last month’s 4.7%, but still much higher than the current rate of inflation, which is concerning many analysts.
- US Preliminary UoM Consumer Sentiment – this was a bit higher than expected, showing a bit more optimizing on the side of US consumers.
- FOMC Meeting Minutes – there was nothing noteworthy, markets barely reacted to the release.
- Reserve Bank of New Zealand Policy Meeting – this produced a surprisingly deep rate cut of 0.50%, while the market was expecting at most only a 0.25% cut, which sent the NZD/USD currency pair to a new 6-month low price.
- Canadian Employment Change – an unexpectedly strong new jobs increase of 60k was recorded. This helped the Canadian Dollar gain a bit against some other currencies after the data release on Friday.
- Canadian Unemployment Rate – the rate unexpectedly fell from 7.2% to 7.1%.
Last week can be divided into two very different segments. Firstly, from the weekly open until just a few hours before the market closed Friday, it was a story of continuation, with stock markets and precious metals rising quite steadily to fresh highs, in most cases, to new all-time highs. Then President Trump tweeted his extreme displeasure at China, threatening to call off his upcoming meeting with Chinese Leader Xi due to what he referred to as China announcing restrictions on its exports of rare earths, which are an essential component for many US tech companies. President Trump stated that in retaliation he will impose a new 100% tariff on all imports from China starting on 1st November, presumably in the hope of hammering out some compromise with China over the rare earths.
The news that we are back in tariff war territory between the US and China sent stocks and risky assets tumbling everywhere, producing dramatic reversals in the market, especially in the US stock market, whose major indices fell by about 3%. This puts a lot of trends into question and unless some compromise is found between the US and China on this issue, we could see very strong moves in the market over the coming days and some wild volatility. The issue is compounded by the fact that markets in the USA will be closed tomorrow (Monday) due to the Columbus Day holiday.
The only trend that survived the Trump tweet is the bullish trend in precious metals, with Gold and Silver recovering to trade above $4,000 and $50 per ounce respectively. Both precious metals reached new all-time highs last week.
There was little else that was noteworthy last week, except for the Reserve Bank of New Zealand’s deeper than expected rate cut of 0.50%, which sent the Kiwi lower. The Trump tweet really hammered the Australian and New Zealand Dollars, which can be expected to be the hardest-hit currencies in the even the US imposes any new tariffs on China. The Japanese Yen saw a recovery on the Trump threat, as a safe-haven currency, but it was the weakest currency over the week.
A potentially indefinite ceasefire in the Middle East was announced last week, which boosted the Israeli Shekel, and may have contributed to risk-on sentiment globally a little.
Top Regulated Brokers
The Week Ahead: 13th– 17th October
The coming week might see more activity in the market, but this will almost certainly be due to the new tariff war between the USA and China, as there are few high-impact data events scheduled for the coming days.
This week’s most important data points, in order of likely importance, are:
- US PPI
- US Retail Sales
- US Unemployment Claims
- UK GDP
- Australian Employment Change
- Australian Unemployment Rate
It is a public holiday in the USA, Canada, and Japan on Monday.
Monthly Forecast October 2025
For the month of October 2025, I forecasted that the EUR/USD currency pair would rise in value. Its performance so far this month is shown in the table below.
Weekly Forecast 12th October 2025
I made no weekly forecast last week.
Although there were notably larger price movements in the Forex market last week compared to recent weeks, there were still no unusually large price movements in currency crosses last week, so I have no weekly forecast this week.
The US Dollar Japanese Yen was the strongest major currency last week, while the Japanese Yen was the weakest. Volatility was higher compared to the previous last week, with 30% of major pairs and crosses changing in value by more than 1%.
Next week’s volatility is quite likely to increase, unless Friday’s tariff threat by President Trump against China is quickly neutralised.
You can trade these forecasts in a real or demo Forex brokerage account.
Technical Analysis
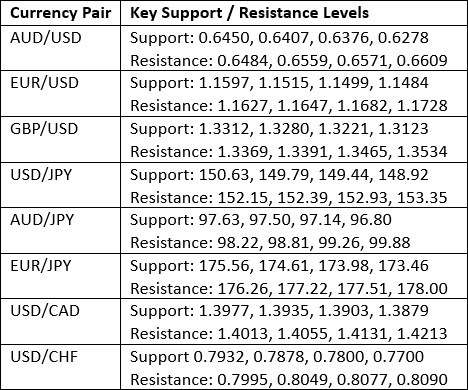
Key Support/Resistance Levels for Popular Pairs
US Dollar Index
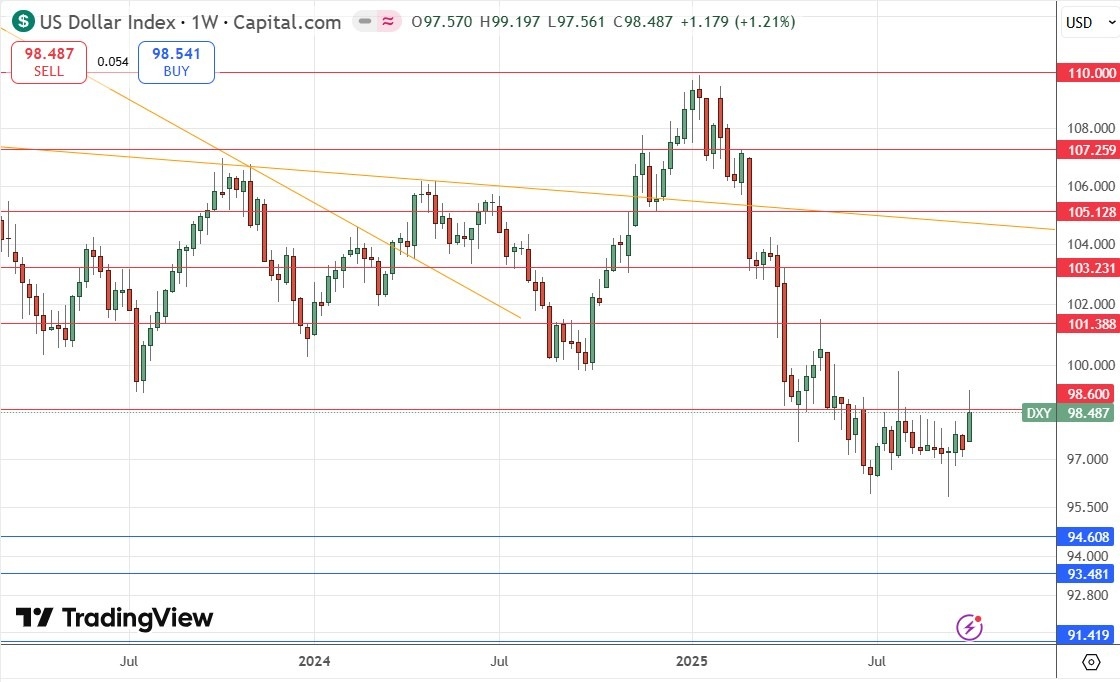
Last week, the US Dollar Index printed a bullish candlestick with a significant upper wick. However, what is most significant here is the fact that the price has still been unable to hold up above the key resistance level at 98.60. If we do eventually get a breakout above this level by the US Dollar, we have already seen a real bottom put in so this could be the start of a major long-term upwards trend. Despite being below its level of 26 weeks ago, the price is above where it was 13 weeks ago, so by my preferred metric, I can declare the long-term bearish trend is over. This places the US Dollar in an interesting position.
The Dollar may take a hit over the coming days if China does not back down over its proposed rare earth export restrictions in the face of President Trump’s 100% China tariff threat, but this situation is producing much more movement in other currencies such as the Australian and New Zealand Dollars (heavily linked to the Chinese economy) and the Japanese Yen (the current haven currency of choice).
NZD/USD
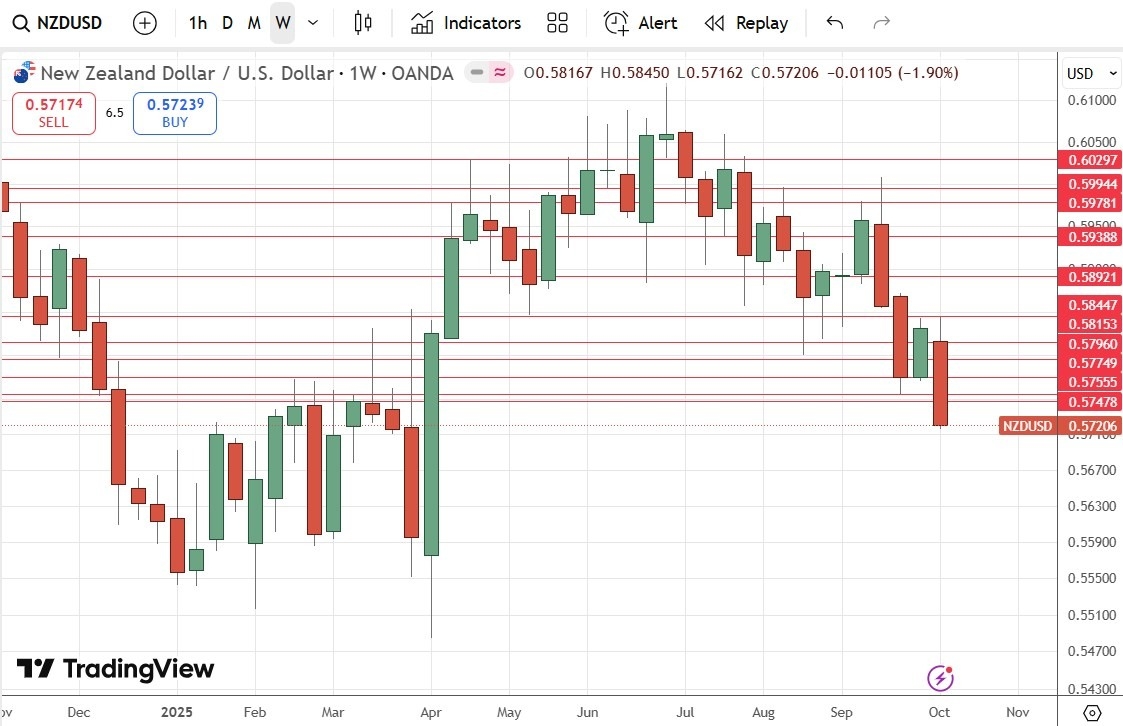
The NZD/USD currency pair fell strongly last week, reversing massively on Friday after rising earlier in the week on President Trump’s tariff threat. The Kiwi is beset by several problems that together have made it extremely weak:
- The bigger than expected rate cut last week by the RBNZ of 0.50%.
- Trump’s tariff threat, which will hurt Chinese exports, and New Zealand is highly exposed to the Chinese economy.
- The poor performance of the New Zealand economy, which is currently seeing a strongly contracting GDP.
On the other side of this pair, the US Dollar – it might take a hit due to the tariff dispute, but this is likely to be a much weaker fall than we will see in the Kiwi while the dispute goes on.
Technically, the weekly candlestick looks very bearish – large, reaching a new 6-month low, and closing very near the low of its range.
This pair does not tend to trend very reliably, but there are forces pushing it down in the face of a new tariff on China, so day traders especially have reason to be interested in this currency pair. The NZD/JPY currency cross might work even better.
AUD/JPY
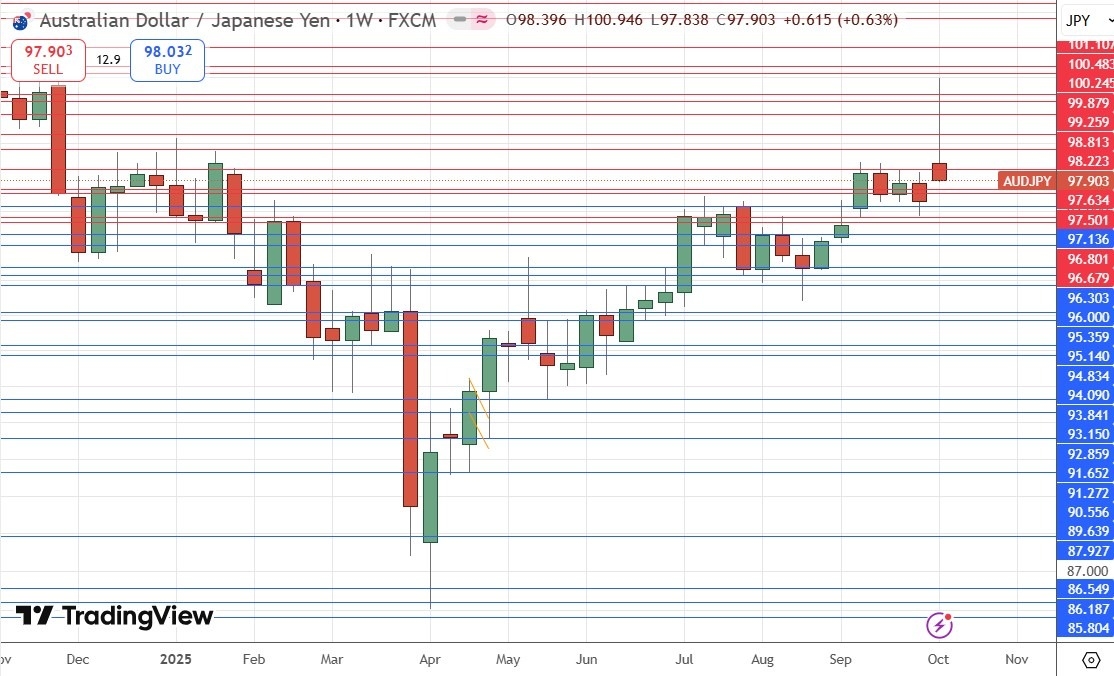
The AUD/JPY currency cross weekly chart printed a large, bearish pin bar, which closed right on the low of its range. These are bearish signs. The Australian Dollar was hit extremely hard by President Trump’s China tariff threat, more than any other currency, as Australia exports so much to China. So, we can expect the Aussie to be very sensitive to the issue, and to shoot higher if it is resolved.
Technically, we see some support even if the bearish fundamentals remain, as the price has reached a congestion area after giving up its gains from earlier in the week.
The Japanese Yen is also likely to rebound if the tariff situation is resolved.
This is probably the best currency cross to use to trade the US/China tariff dispute, with the AUD a great proxy for China and risk appetite in general, and the Japanese Yen’s current status as the number one haven currency.
S&P 500 Index
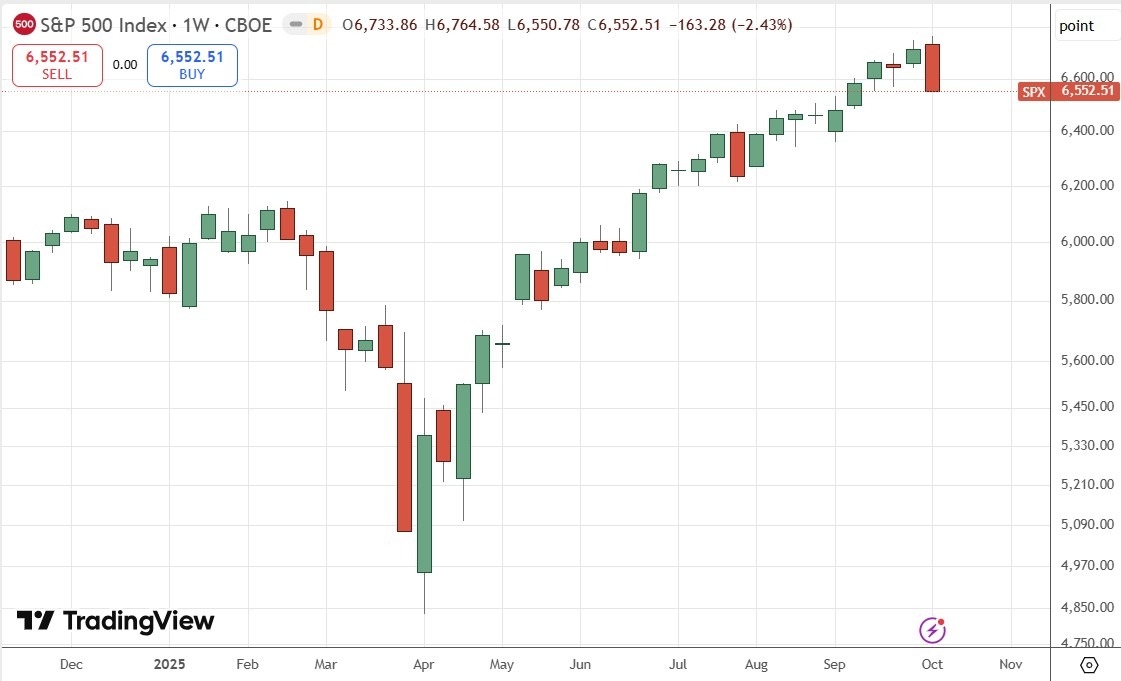
After rising to new all-time highs earlier in the week, the S&P 500 Index plummeted by almost 3% in the last few hours of Friday’s trading, wiping out the past three weeks of gains, after President Trump announced he would be imposing a new 100% tariff on Chinese imports die to their proposed restrictions on rare earth exports, which are vital to the American and global tech industry. Another concern bubbling away in the background is whether the American stock market is in an artificial intelligence bubble, as the major indices valuations have become heavily centered on just a few tech companies which are mostly focusing on AI.
We might see further strong falls if this US/China standoff is not resolved very quickly. After several months of very strong gains, the US stock market looks vulnerable to a sudden crash. Further falls when the US market opens on Tuesday might knock out trend followers from their longstanding long positions in major US equity indices.
If the dispute is resolved, expect a fast and strong recovery, but I have a gut feeling we will not see fresh highs soon.
There may be opportunities here over the coming days either long or short for more experienced traders, while novices might do better to sit this one out, although investors might want to reduce long positions in these stocks if the dispute deepens.
There is one note of hope for bulls – the two major stock markets open at the time of writing (a Sunday) in Saudi Arabia and Israel, are seeing gains or holding steady. Of course, both markets have strong local factors helping buying, but it is a potentially positive sign.
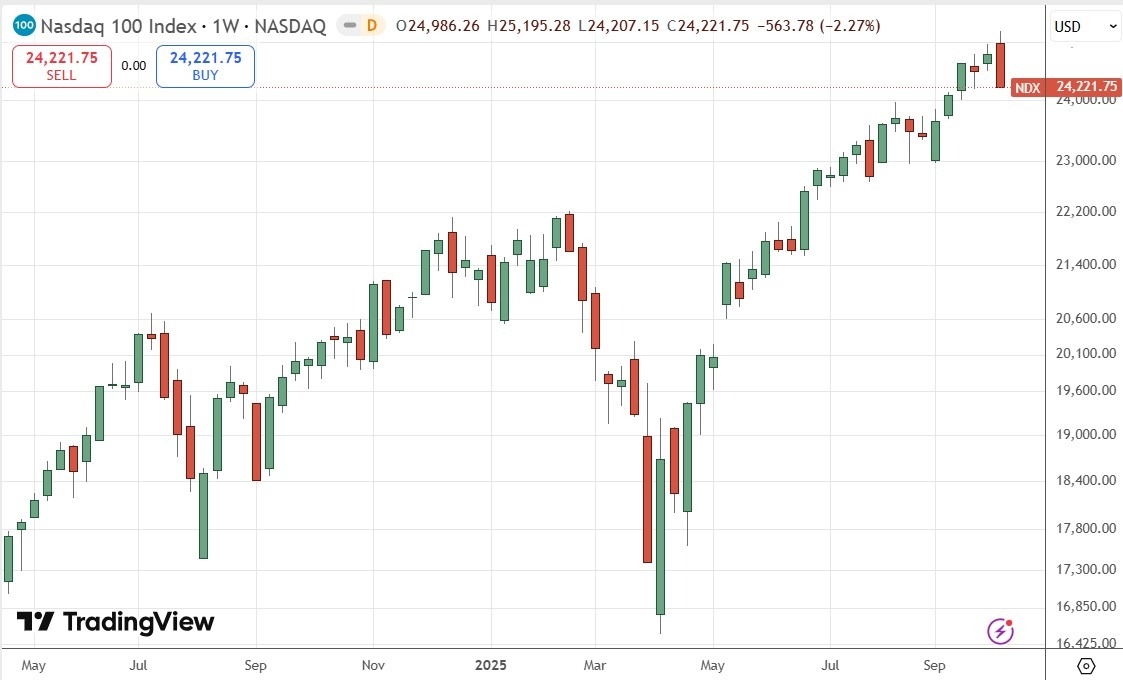
NASDAQ 100 Index
Everything I wrote above about the S&P 500 Index also applies to the NASDAQ 100 Index, but even more so, because the stocks making up this index are even more sensitive to the US/China dispute and the need for rare earth imports. This index fell by more than 3% late Friday, but it only wiped out the last 2 weeks of gains.
Just as in the S&P 500 Index, there can be opportunities coming here for more experienced traders, to try to day trade short as long as the dispute deepens, but to be ready to go long quickly if it is resolved.
XAG/USD
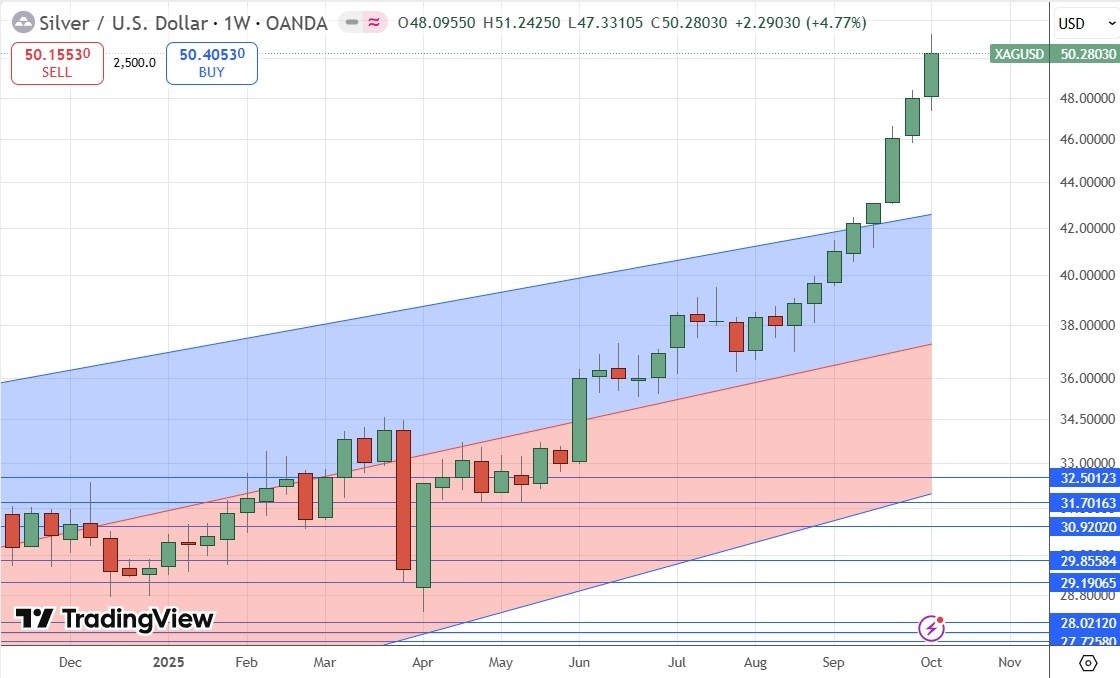
Silver had yet another great week, showing yet another outsize rise in value of more than 4%, and finally making a new record high above $51 which exceeded the Hunt Brothers high of 1980. It also outperformed Gold and all other precious metals except Palladium. These are bullish signs, as is the breakout from the linear regression analysis shown within the price chart below – the price is well above the upper bound.
There are also reports that a strong short squeeze is ongoing, with concerns over how much Silver bullion is available to holders of short positions.
With Silver’s outperformance against Gold, it is probably worth being bold on the long side here.
Having said, if you are just entering a new long trade here, as the move is quite extended, a smaller position size might be wise. Volatility is high, so a strong downwards movement is possible when the retracement finally comes.
I remain very bullish on Silver but worry that it may come crashing down – this is how big short squeezes tend to end. Trading the trend with a trailing stop is a good answer to this dilemma if you do it systematically. How high it might go now that we have seen a weekly close above $50 into blue sky is anyone’s guess.
XAU/USD
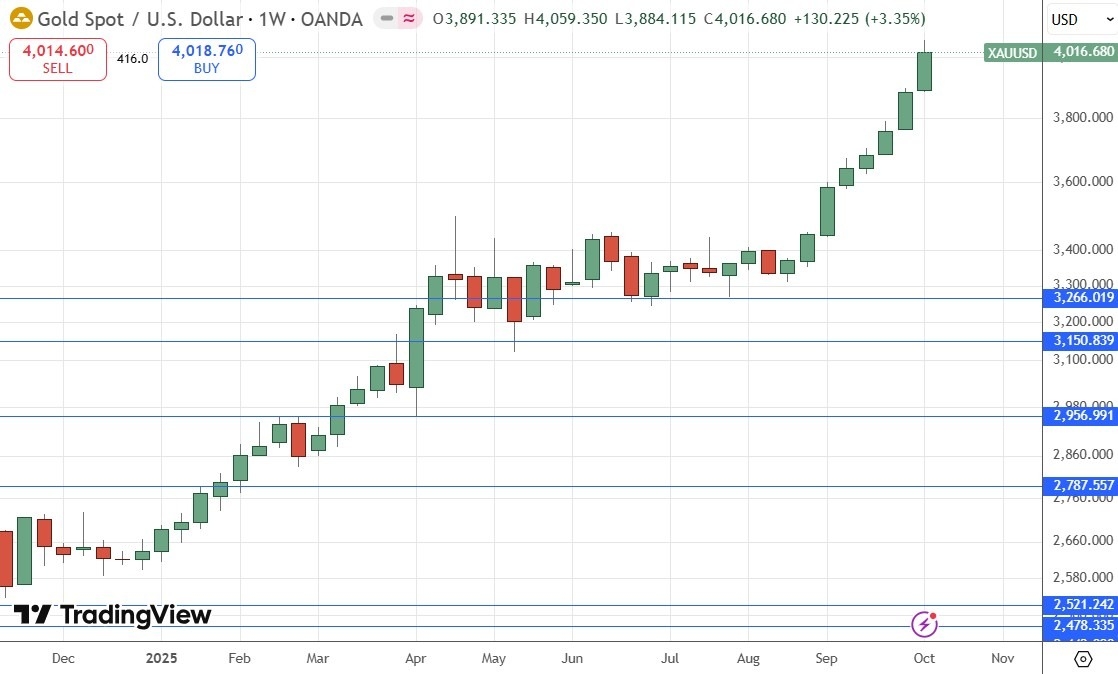
Gold rose again last week, by more than 3%, to rise to print a new all-time high, closing above the big round number at $4,000. Silver also closed above $50, which is another bullish factor for precious metals in general.
The long-term bullish trend and break to new record highs are bullish factors, and the fact that precious metals including Gold held up Friday despite the stock crash when Trump threatened huge new tariffs on China is also bullish – and intriguing.
For anyone who is only entering a long trade now, it might be wise to use a smaller position size to account for any sudden high-volatility snapback towards lower prices. You must wonder how much further this bull run will last – but it is backed by a very strong long-term bullish trend, and you trade against that at your peril unless you start to see clear signs of a reversal in the price action – which is not showing here yet.
I remain bullish on Gold, but it might be wise to take a smaller long position here than would be usual for you.
Platinum
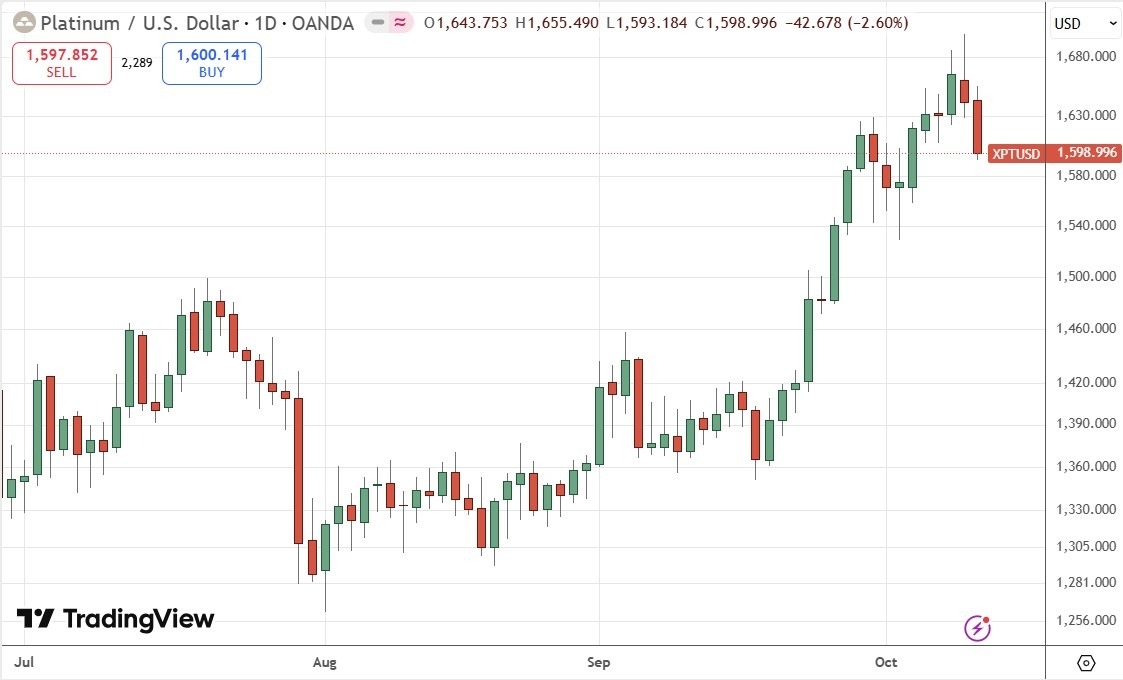
Platinum rose last week to a new multi-year high price, but the daily chart below shows that it sold off quite firmly (compared to the other precious metals) towards the end of last week, and this was well before President Trump’s tariff threat.
This suggests that Platinum is not the best choice of precious metals to be long of right now, but it is often a good idea to be diversified when you are trading trends, so it is worth paying attention here. The strong bullish trends in Gold and Silver back this reasoning, as the asset class overall in a strong trend.
I think that entering a new long trade could be a good idea if we get another long-term high New York close, above $1,666.
If your broker does not offer Platinum, and Platinum futures are too big for you, there is a Platinum ETF offering exposure (PPLT).
Palladium
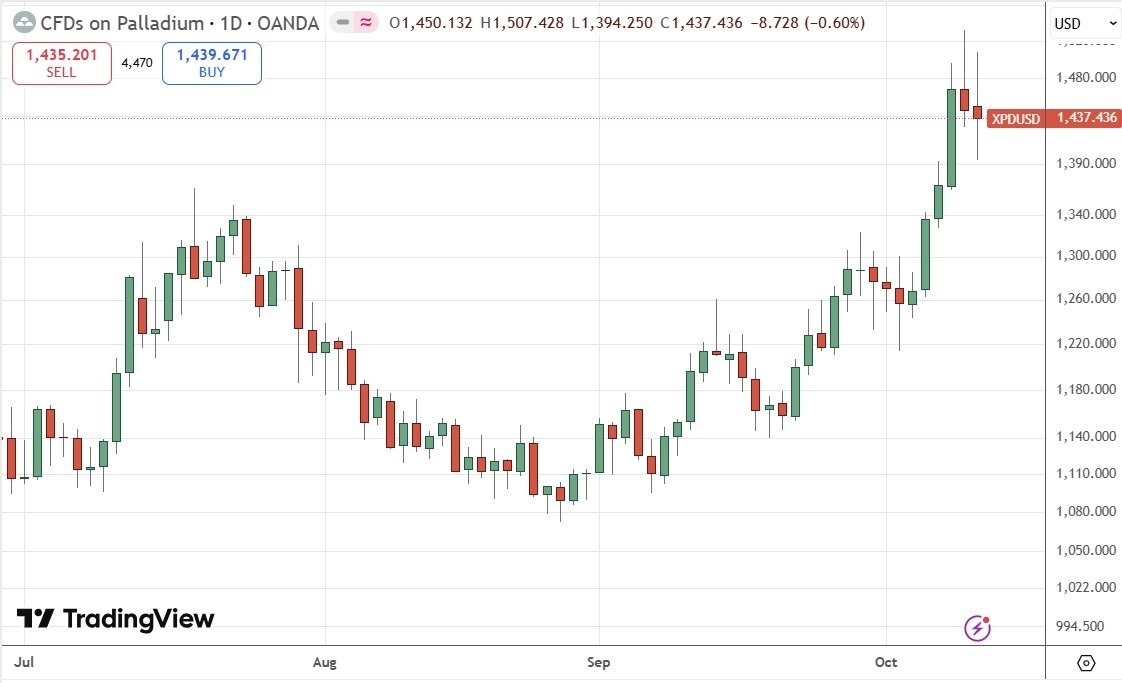
Palladium rose last week to a new multi-year high price, and the daily chart below shows that it made only a small bearish retracement on Thursday and Friday after its meteoric rise of over 9% on Wednesday.
This suggests that Platinum is a good choice of precious metal to be long of right now, but I would like to see another break to a fresh high in the New York close before entering a new long position. The strong bullish trends in Gold and Silver and the asset class of precious metals reinforce my bullishness.
I think that entering a new long trade could be a good idea if we get another long-term high New York close, above $1,468.
If your broker does not offer Palladium, and Palladium futures are too big for you, there is a Palladium ETF offering exposure (PALL).
Bottom Line
I see the best trades this week as:
- Long of Silver.
- Long of Gold.
- Long of Platinum following a daily (New York) close above $1,666.
- Long of Palladium following a daily (New York) close above $1,468.
Ready to trade our weekly Forex forecast? Check out our list of the best Forex brokers.


