Short Trade Idea
Enter your short position between $885.88 (yesterday’s intra-day low) and $933.00 (the lower band of a horizontal resistance zone).
Market Index Analysis
- United Rentals (URI) is a member of the S&P 500 Index.
- This index recorded a fresh record high, fueled by an AI bubble.
- The Bull Bear Power Indicator of the S&P 500 is bullish but indicates upward exhaustion.
Market Sentiment Analysis
Equity futures are trading in and out of positive territory. Yesterday’s session saw bulls take charge amid optimism about a broader US-China trade deal that could include agreements on rare-earth minerals, soybeans, and TikTok. The FOMC will start its two-day meeting today. While markets have priced in a 25-basis point interest rate cut, attention will shift to the outlook, where divisions among voting members could widen over future rate cuts. In the meantime, the AI bubble continues to expand globally, and underlying risks are rising.
United Rentals Fundamental Analysis
United Rentals is an equipment rental company that owns the world’s largest rental fleet. It has over 4,800 classes of equipment with an original equipment cost (OEC) exceeding $20.59 billion and maintains over 1,625 locations, primarily in the US.
So, why am I bearish on URI after its earnings disappointment?
Declining profit margins and higher capital expenditure due to tariffs could further erode earnings power, while the current economic backdrop poses a revenue challenge for United Rentals. Long-term debt is rising, and the meager dividend yield fails to compensate investors for the added risks. URI is also one of the most expensive stocks in its industry. Not only did URI miss EPS expectations, but it also reported lower EPS compared to one year ago.

United Rentals Fundamental Analysis Snapshot
The price-to-earning (P/E) ratio of 23.20 makes URI an expensive stock compared to its peers but inexpensive relative to the S&P 500. By comparison, the P/E ratio for the S&P 500 is 30.52.
The average analyst price target for URI is $1,019.25, suggesting good upside potential, but outsized downside risks.
United Rentals Technical Analysis
Today’s URI Signal

United Rentals Price Chart
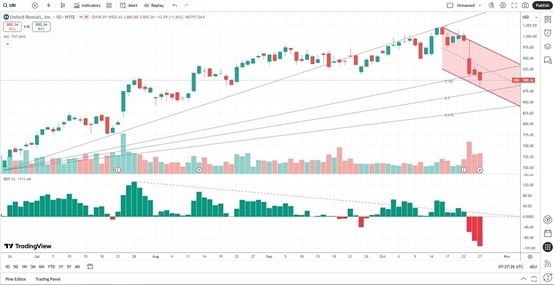
- The URI D1 chart shows price action inside a bearish price channel.
- It also shows price action between its ascending 38.2% and 50.0% Fibonacci Retracement Fan levels, following a breakdown.
- The Bull Bear Power Indicator is bearish with a descending trendline.
- The average bearish trading volumes are higher than the average bullish trading volumes.
- URI corrected as the S&P 500 Index hit fresh records, a bearish confirmation.
My Call on United Rentals
I am taking a short position in URI between $885.88 and $933.00. Profit margins are declining, revenue growth is slowing, and earnings per share are moving in the wrong direction. I expect higher capital expenditures and slower growth to accelerate the trend.
Top Regulated Brokers
- URI Entry Level: Between $885.88 and $933.00
- URI Take Profit: Between $693.78 and $745.04
- URI Stop Loss: Between $949.91 and $991.08
- Risk/Reward Ratio: 3.00
Ready to trade our free stock signals? Here is our list of the best stock brokers worth checking out.
