
Ongoing healthcare innovation, low valuations, and a history of beating earnings expectations create an interesting investment case. Can the breakout in Cigna Group continue?
Long Trade Idea
Enter your long position between $302.79 (the intra-day low of its last bullish candlestick) and $310.88 (yesterday’s intra-day high).
Market Index Analysis
- The Cigna Group (CI) is a member of the S&P 500 index.
- This index grinds the AI wave higher, fueling an AI bubble, while bearish conditions accumulate.
- The Bull Bear Power Indicator of the S&P 500 shows a negative divergence and does not support the uptrend.
Market Sentiment Analysis
The AI bubble continues with NVIDIA driving markets to fresh records yesterday. Minutes from the latest FOMC meeting showed a majority supported further interest rate cuts, as they see greater risks to employment while inflation remained stagnant. Still, several members preferred no cut. The third quarter earnings season has begun, and it should provide the next catalyst for the market. Warnings about the dangerous unraveling of a bursting AI bubble continue, consumer debt levels across all income levels are alarming, and gold continues its record rally.
The Cigna Group Fundamental Analysis
The Cigna Group is a healthcare and insurance company providing medical, dental, disability, life, and accident insurance. It focuses on offering its insurance products through employers and other groups, and CI ranks among the largest US-based companies by revenue.
So, why am I bullish on CI through its breakout sequence?
The Cigna Group remains on a positive fundamental trajectory, reporting upbeat sales statistics. I am also buying into its adoption of AI imaging coverage, and its market position as government and regulatory changes create uncertainty and challenging business conditions. CI is also active in the specialty pharma sector, has a solid share buyback program, and low valuations.
Metric | Value | Verdict |
P/E Ratio | 16.81 | Bullish |
P/B Ratio | 1.97 | Bullish |
PEG Ratio | 0.53 | Bullish |
Current Ratio | 0.79 | Bearish |
ROIC-WACC Ratio | Positive | Bullish |
The Cigna Group Fundamental Analysis Snapshot
The price-to-earnings (P/E) ratio of 16.81 makes CI an inexpensive stock. By comparison, the P/E ratio for the S&P 500 is 30.17.
The average analyst price target for CI is $367.22. It suggests good upside potential with acceptable downside risks.
The Cigna Group Technical Analysis
Today’s CI Signal
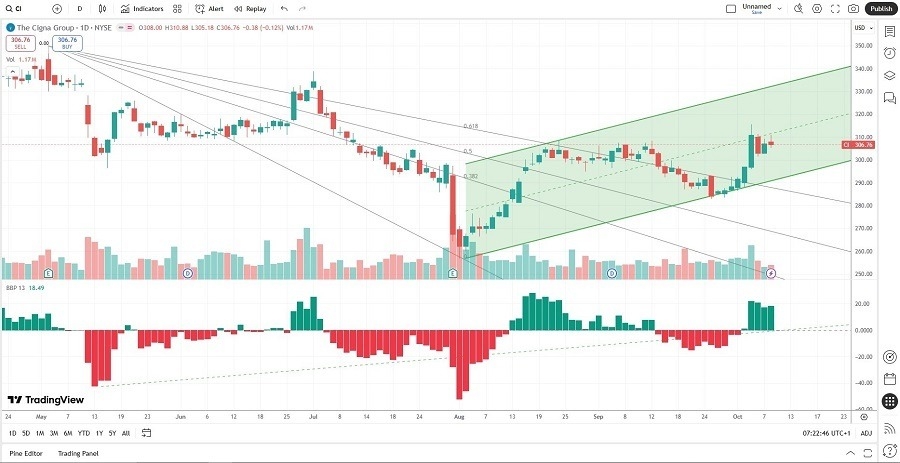
Cigna Group Price Chart
- The CI D1 chart shows price action inside a bullish price channel.
- It also shows price action breaking out above its ascending Fibonacci Retracement Fan.
- The Bull Bear Power Indicator is bullish with an ascending trendline.
- The average bullish trading volumes are higher than the average bearish trading volumes.
- CI accelerated as the S&P 500 recorded fresh all-time highs, a significant bullish trading signal.
My Call on the Cigna Group
I am taking a long position in CI between $302.79 and $310.88. Valuations are low, and the PEG ratio suggests a massively undervalued company. CI embraces AI well, and I rank it as the managed healthcare company best positioned to weather the ongoing uncertainty.
- CI Entry Level: Between $302.79 and $310.88
- CI Take Profit: Between $358.88 and $367.22
- CI Stop Loss: Between $276.59 and $282.80
- Risk/Reward Ratio: 2.14
Top Regulated Brokers
Ready to trade our free stock signals? Here is our list of the best stock brokers worth checking out.