
Small-cap stocks too often make the headlines for the wrong reasons, including massive price swings, fraudulent activity, and accounting scandals. Most investors prefer large-cap and mega-cap stocks, such as those in the Magnificent Seven. Yet small-cap stocks offer the best growth potential of any cap size stocks. Should you consider adding some underdogs to your portfolio?
While there is no universal definition, small-cap stocks are publicly listed companies with market capitalizations between $250 million and $2 billion. The “cap” is short for market capitalization, which is the number of shares multiplied by the share price. For example:
- Company XY2 has 50 million shares, and each share trades at $10.
- Therefore, the market cap is $500,000,000 (50 million x $10).
The Russell 2000 equity index is the primary small-cap index. It covers 2,000 small caps with market values between $240 million and $6 billion. Some argue that a few components of the Russell 2000 are mid-cap stocks, as the equity bull market has technically lifted them out of small-cap territory. Other small-cap indices are the S&P SmallCap 600 and the MSCI USA Small-Cap Index.
The Financial Industry Regulatory Authority (FINRA) has the following definition of small-cap, medium-cap, and large-cap stocks:
- Small-cap stocks have a market cap from $250 million to $2 billion.
- Mid-cap stocks have a market cap above $2 billion but below $10 billion.
- Large-cap stocks have a market cap exceeding $10 billion.
Why Should You Consider Buying Small-cap Stocks?
Small-cap stocks offer exciting stories, disruptive technologies and services, portfolio diversification, and can deliver above-average growth, but investors must accept higher risks.
Here are a few things to consider when evaluating small-cap stocks:
- Look for companies with a product or service in a high-growth sector with a disruptive advantage.
- Favour small caps with annualized EPS growth of 25% or more.
- Ensure the current price trades at a discount to the average analyst price target.
- Buy small cap stocks in a separate portfolio and do not mix them with other investments.
What are the Downsides of Small-Cap Stocks?
Investing in small-cap stocks carries greater risks due to unknown factors, shaky balance sheets, and challenging business conditions. After all, there is a reason why small-caps are small-caps. Investors must also accept greater volatility.
Here is a shortlist of small-cap stocks to consider:
- DigitalBridge Group (DBRG)
- Teradata Corporation (TDC)
- Lithium Americas Corporation (LAC)
- Consolidated Water (CWCO)
- Evolv Technologies Holdings (EVLV)
- SES AI Corporation (SES)
- Innodata (INOD)
- Xunlei (XNET)
- Serve Robotics (SERV)
- X Financial (XYF)
Update on My Previous Best Small Cap Stocks to Buy Now
In our previous installment, I highlighted the upside potential of DigitalBridge Group and Teradata Corporation.
DigitalBridge Group (DBRG) - A long position in DBRG between $9.06 and $9.84
DBRG rallied over 33%, and I closed my position at $13.50. While price action corrected into its ascending 38.2% Fibonacci Retracement Level, I am not re-entering this trade.
Teradata Corporation (TDC) - A long position in TDC between $20.15 and $20.97
TDC advanced over 13%, and my stop-loss closed it for a profit at $22.50, just shy of 10%. The correction has brought the price back into my previous buy zone, and I will go for round two.
Evolv Technologies Holdings Fundamental Analysis
Evolv Technologies Holdings provides AI-based, non-invasive, advanced security technologies and security screening solutions. It transforms physical security with advanced, extensible solutions designed for schools, stadiums, transit hubs, and corporate offices.
So, why am I bullish on EVLV after its price doubled since April?
The need for non-invasive AI-based security solutions remains in its infancy, but I expect demand to outstrip supply moving forward. The addressable market for Evolv Technologies Holdings is expanding, which should boost double-digit revenue growth. EVLV reported positive cash flow from operations, gross margins rank among the best in its industry, and the earnings-per-share growth is impressive.
Metric | Value | Verdict |
P/E Ratio | Unavailable | Bearish |
P/B Ratio | 13.93 | Bearish |
PEG Ratio | Unavailable | Bearish |
Current Ratio | 0.93 | Bearish |
Return on Assets | -31.52% | Bearish |
Return on Equity | -95.40% | Bearish |
Profit Margin | Unavailable | Bearish |
ROIC-WACC Ratio | Unavailable | Bearish |
Dividend Yield | 0.00% | Bearish |
Evolv Technologies Holdings Fundamental Analysis Snapshot
The price-to-earnings (P/E) for EVLV is negative. By comparison, the P/E ratio for the S&P 500 Index is 29.79.
The average analyst price target for Evolv Technologies Holdings is $9.50. It suggests excellent upside potential with manageable downside risks.
Evolv Technologies Holdings Technical Analysis
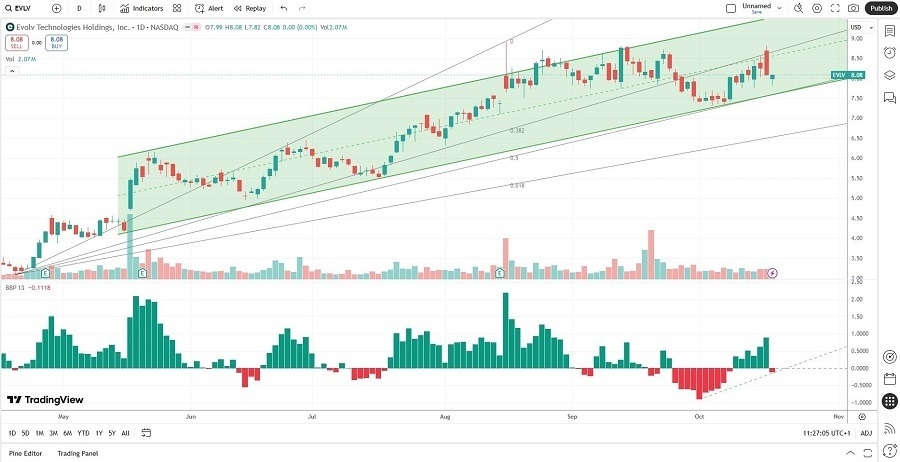
Evolv Technologies Holdings Price Chart
- The EVLV D1 chart shows price action between its ascending 38.2% and 50.0% Fibonacci Retracement Fan levels.
- It also shows Evolv Technologies Holdings inside a bullish price channel.
- The Bull Bear Power Indicator turned bearish, but near its ascending trendline.
My Call on Evolv Technologies Holdings
I am taking a long position in EVLV between $7.82 and $8.20. I anticipate EVLV to secure more long-term contracts with hospitals and public school systems, while its ongoing advancements and updates should boost client retention rates.
X Financial Fundamental Analysis
X Financial is a Chinese FinTech platform connecting borrowers on its platform with its institutional funding partners. Thanks to its big-data-driven technology, XYF has established numerous strategic partnerships with financial institutions.
So, why am I bullish on XYF despite its pullback?
I like how X Financial uses its technology to facilitate loans to prime borrowers while it deploys robust risk assessment and control systems. The top three shareholders hold 54% of XYF, while its CEO holds a 43% stake, with limited institutional shareholdings. Therefore, buying this FinTech firm means buying the vision of its CEO, who has done a remarkable job to date, as confirmed by operational stats that rank at the top of its industry.
Metric | Value | Verdict |
P/E Ratio | 2.67 | Bullish |
P/B Ratio | 0.54 | Bullish |
PEG Ratio | Unavailable | Bearish |
Current Ratio | 1.59 | Bearish |
Return on Assets | 12.77% | Bullish |
Return on Equity | 22.63% | Bullish |
Profit Margin | 23.29% | Bullish |
ROIC-WACC Ratio | Positive | Bullish |
Dividend Yield | 3.54% | Bullish |
X Financial Fundamental Analysis Snapshot
The price-to-earnings (P/E) ratio of 2.67 makes XYF an inexpensive stock. By comparison, the P/E ratio for the S&P 500 Index is 29.79.
The average analyst price target for X Financial is $15.00. It suggests moderate upside potential with decreasing downside risks.
X Financial Technical Analysis 
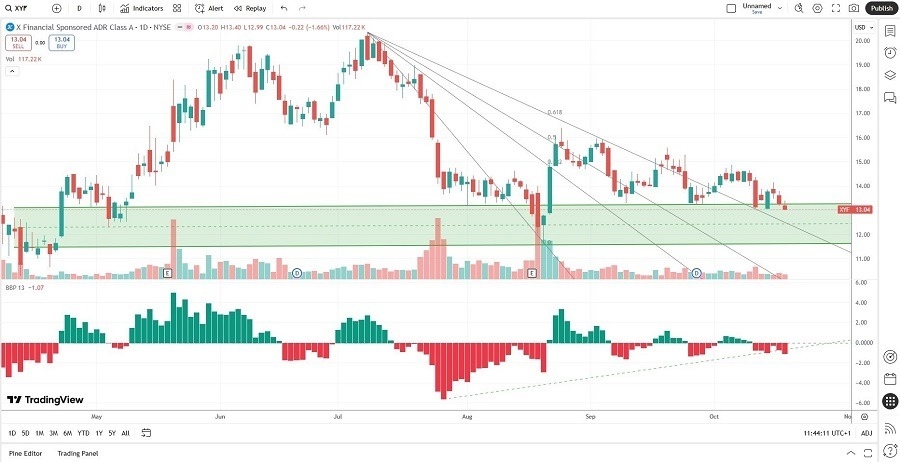
X Financial Price Chart
- The XYF D1 chart shows price action above its descending Fibonacci Retracement Fan.
- It also shows X Financial entering a massive horizontal support zone.
- The Bull Bear Power Indicator is bearish but remains within its ascending support level.
My Call on X Financial
I am taking a long position in XYF between $11.62 and $13.20. XYF has excellent operational statistics, a deep understanding of its market, creates shareholder value, and pays a good dividend yield, which is rare for a small-cap stock. XYF is one of the most undervalued stocks I have researched this year.
Top Regulated Brokers
Ready to trade our daily stock signals? Here is our list of the best stock brokers worth reviewing.