
Inflationary pressures remain elevated, oil prices are relatively low, and the global economy sputters along. Current developments and energy policy in the US have created an interesting investment case, while the demand from data centers is challenging the supply. Get a shortlist of the best energy stocks to buy now.
What are Energy Stocks?
Energy stocks refer to publicly listed companies that engage in the energy sector. The energy industry consists of the upstream, midstream, and downstream sectors. It also includes renewable energy sources. The upstream sector consists of the exploration and production of energy sources. The midstream sector connects the upstream and downstream sectors via pipelines, tanks, terminals, and logistics. The downstream component refines, processes, and distributes finished energy products.
Why Should you Consider Buying Energy Stocks?
Energy stocks offer exciting stories, disruptive technologies and services, portfolio diversification, and can deliver above-average growth, but investors must accept higher risks.
Below are three reasons you should consider adding a few energy stocks to your portfolio:
- Energy stocks offer low correlation to other asset classes for portfolio diversification.
- Investors can achieve a high-quality inflation hedge, as energy stocks benefit from higher oil prices.
- Energy stocks offer attractive yields due to above-average dividend payments for long-term dividend portfolios.
What are the Downsides of Energy Stocks?
The volatility of energy prices and the global move to become carbon-neutral as soon as possible, but unlikely before 2050, pose long-term risks beyond 2035. Data center demand may fall short of expectations, and an AI-led bubble could burst, potentially leading to an economic slowdown.
Here is a shortlist of currently attractive energy stocks:
- Schlumberger (SLB)
- Halliburton (HAL)
- NextEra Energy (NEE)
- ConocoPhillips (COP)
- Enbridge (ENB)
- Brookfield Renewable Partners (BEP)
- Peabody Energy Corporation (BTU)
- Stem (STEM)
- Occidental Petroleum (OXY)
- EOG Resources (EOG)
- Murphy Oil Corporation (MUR)
- Energy Transfer (ET)
Update on my Previous Best Energy Stocks to Buy Now
In our previous installment, I highlighted the upside potential of Schlumberger and Halliburton.
Schlumberger (SLB) - A long position in SLB between $34.30 and $35.19
SLB rallied over 7% before retreating. It is now trading in the same zone as during my previous recommendation, and I would add it to my portfolio again.
Halliburton (HAL) - A long position in HAL between $20.99 and $21.63
HAL surged over 20% plus, and remains within an uptrend, but it has retreated moderately. I closed my long position but will happily reopen it if the current retreat turns into a broader sell-off.
EOG Resources Fundamental Analysis
EOG Resources (EOG) is an energy company engaged in the exploration of hydrocarbons. It has over 98% of its operations and reserves in the US, followed by Trinidad and Tobago, and negligible reserves in Canada and China. EOG Resources is exploring oil fields in Oman and the UAE. It is also a member of the Russell the S&P 500 Index.
So, why am I bullish on EOG Resources despite its correction?
The Permian Basin continues to fuel energy companies with deep roots in the region, and EOG Resources remains dominant there. EOG deploys advanced drilling technology, proprietary methods, and self-sourced materials. It results in one of the lowest breakeven levels in the energy sector. The valuations are very low, and the dividend yield is respectable.
Metric | Value | Verdict |
P/E Ratio | 10.75 | Bullish |
P/B Ratio | 2.06 | Bullish |
PEG Ratio | 7.14 | Bearish |
Current Ratio | 1.79 | Bearish |
Return on Assets | 12.38% | Bullish |
Return on Equity | 19.60% | Bullish |
Profit Margin | 25.22% | Bullish |
ROIC-WACC Ratio | Positive | Bullish |
Dividend Yield | 3.70% | Bullish |
EOG Resources Fundamental Analysis Snapshot
The price-to-earnings (P/E) ratio of 10.75 makes EOG an inexpensive stock. By comparison, the P/E ratio for the S&P 500 is 30.26.
Top Regulated Brokers
The average analyst price target for EOG Resources is $139.50. This suggests excellent upside potential with manageable downside risks.
EOG Resources Technical Analysis
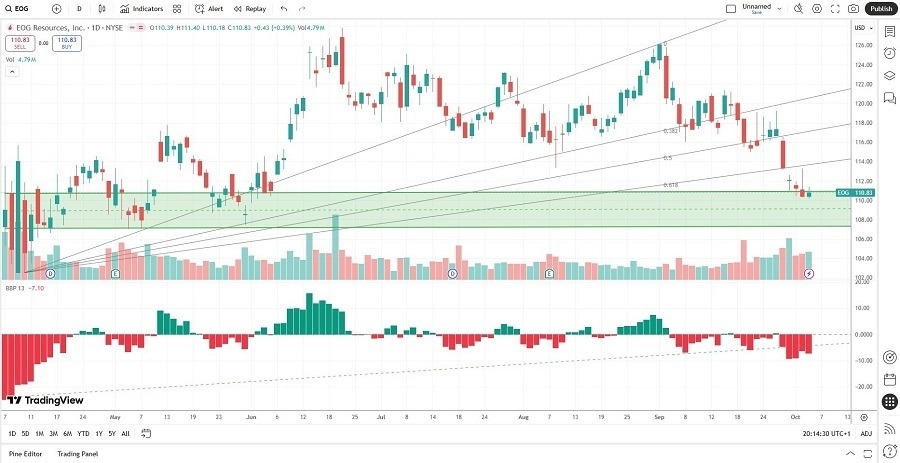
EOG Resources Price Chart
- The EOG D1 chart shows price action below its ascending Fibonacci Retracement Fan.
- It also shows EOG Resources entering a horizontal support zone.
- The Bull Bear Power Indicator turned bearish but remains within its ascending support level.
My Call on EOG Resources
I am taking a long position in EOG Resources between $107.06 and $111.40. Low valuation, excellent reserves, a superb return on assets, and solid profit margins should drive the Permian Basin powerhouse ahead. I am buying into the correction.
Energy Transfer LP Fundamental Analysis
Energy Transfer LP (ET) is a midstream natural gas company engaged in pipeline transportation and storage for natural gas, crude oil, NGLs, refined products, and liquid natural gas (LNG). ET is one of the largest US midstream companies with over 125,000 miles of pipelines. It is also one of the leading global LNG exporters.
So, why am I bullish on ET despite its recent downtrend?
Energy Transfer LP is another dominant Permian Basin energy stock following its $7.1 billion acquisition of WTG. It is also ideally positioned to capture surging demand from data centers. I like its growing international portfolio, valuations are low, and the market has mispriced ET, making it one of the most undervalued midstream natural gas companies.
Metric | Value | Verdict |
P/E Ratio | 13.02 | Bullish |
P/B Ratio | 1.67 | Bullish |
PEG Ratio | 0.72 | Bullish |
Current Ratio | 1.15 | Bearish |
Return on Assets | 3.57% | Bullish |
Return on Equity | 12.85% | Bullish |
Profit Margin | 5.55% | Bearish |
ROIC-WACC Ratio | Negative | Bearish |
Dividend Yield | 7.38% | Bullish |
Energy Transfer LP Fundamental Analysis Snapshot
The price-to-earnings (P/E) ratio of 13.02 makes ET an inexpensive stock. By comparison, the P/E ratio for the S&P 500 Index is 30.26.
The average analyst price target for ET is $22.39. This suggests excellent upside potential with fading downside risks.
Energy Transfer LP Technical Analysis
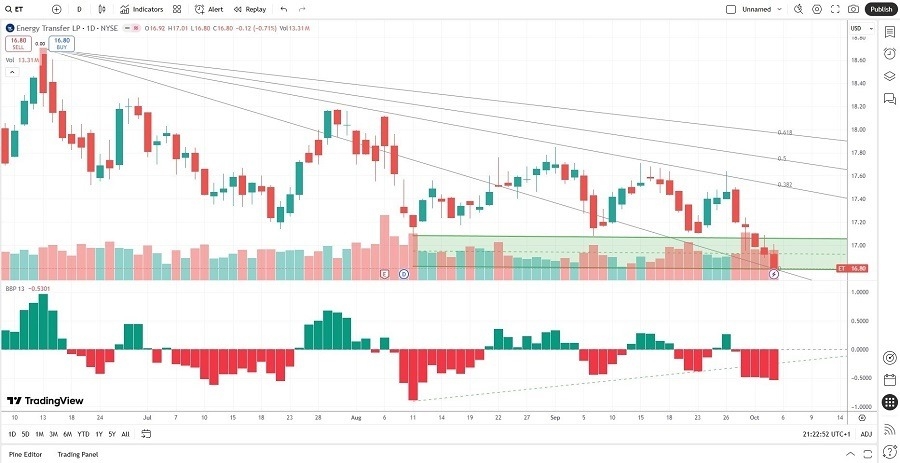
Energy Transfer LP Price Chart
- The ET D1 chart shows price action between its descending 0.0% and 38.2% Fibonacci Retracement Fan.
- It also shows Energy Transfer LP testing the lower band of a new horizontal support zone.
- The Bull Bear Power Indicator is bearish but remains close to its ascending support level.
My Call on Energy Transfer LP
I am taking a long position in ET between $16.80 and $17.08. I like the strategic acquisition to strengthen its presence in the Permian Basin. The low valuation and PEG ratio make an appealing buy case, and the superb dividend yield compensates investors for short-term volatility.
Ready to trade our free stock signals? Here is our list of the best stock brokers worth checking out.