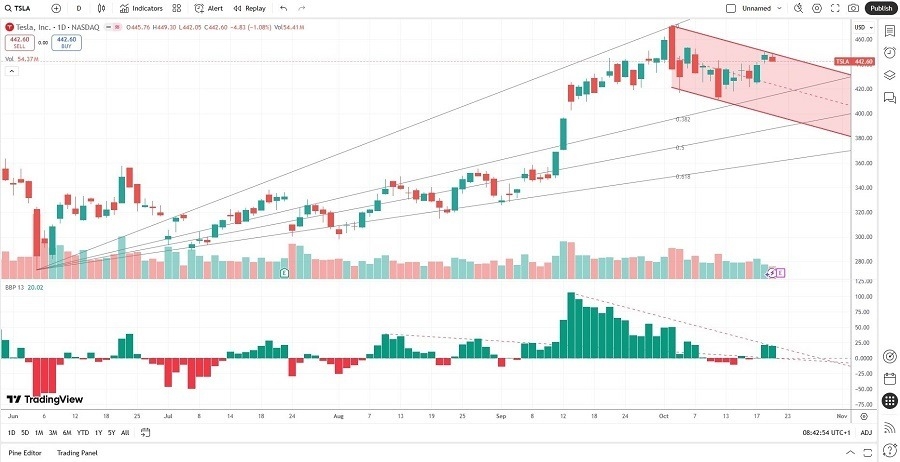
Short Trade Idea
Enter your short position between $435.35 (a minor horizontal support level) and $449.80 (the intra-day high of its last bullish candlestick).
Market Index Analysis
- Tesla (TSLA) is a member of the NASDAQ 100, the S&P 100, and the S&P 500 indices.
- All three indices attempt to hold on to their record gains, but the third quarter earnings season could magnify bearish cracks.
- The Bull Bear Power Indicator shows a negative divergence and does not confirm the uptrend.
Market Sentiment Analysis
Netflix provided the first significant earnings disappointment after the bell, followed by Mattel, and investors look ahead to Tesla earnings today, the first of the Magnificent Seven stocks to report. GM reported upbeat earnings, but expiring EV credits could cloud Tesla’s outlook and trigger a sell-off in equity markets. The government shutdown continues, President Trump keeps markets guessing about his approach to the US-China trade war, and doubt persists about the quality of this week’s inflation data.
Tesla Fundamental Analysis
Tesla is one of the world’s most valuable companies by market capitalization, but it faces stiff competition from Chinese rivals. Expiring EV credits add to declining market share and shrinking profit margins.
So, why am I bearish on TSLA ahead of its earnings?
Valuations are excessive and unsupported by fundamentals. I expect profit margins to continue to contract, while earnings per share might come under pressure. The expiration of EV credits may have caused some sellers to take advantage of the incentive, which will lower the outlook for the next quarter. Investors are also satisfied with Elon Musk’s proposed $1 trillion pay package and the company’s justification for it.

Tesla Fundamental Analysis Snapshot
The price-to-earnings (P/E) ratio of 263.45 makes TSLA an expensive stock. By comparison, the P/E ratio for the NASDAQ 100 is 38.60.
The average analyst price target for TSLA is $366.77, which TSLA has overshot by over 20%, suggesting no upside potential and increased downside risks.
Tesla Technical Analysis
Today’s TSLA Signal

Tesla Price Chart
- The TSLA D1 chart shows price action inside a bearish price channel.
- It also shows price action trading between its ascending 0.0% and 38.2% Fibonacci Retracement Fan levels.
- The Bull Bear Power Indicator is bullish with a negative divergence.
- The average bearish trading volumes are higher than the average bullish trading volumes.
- TSLA advanced with NASDAQ 100, a bullish confirmation, but faces increasing downside risks.
My Call on Tesla
I am taking a short position in TSLA between $435.35 and $449.80. Valuations and the PEG ratio suggest an overly extended stock, while I am concerned about scrapped subsidies in its core markets and rising competition, which increasingly sells better cars for less money.
- TSLA Entry Level: Between $435.35 and $449.80
- TSLA Take Profit: Between $273.21 and $297.82
- TSLA Stop Loss: Between $470.75 and $494.29
- Risk/Reward Ratio: 3.45
Ready to trade our daily stock signals? Here is our list of the best stock brokers worth reviewing.
