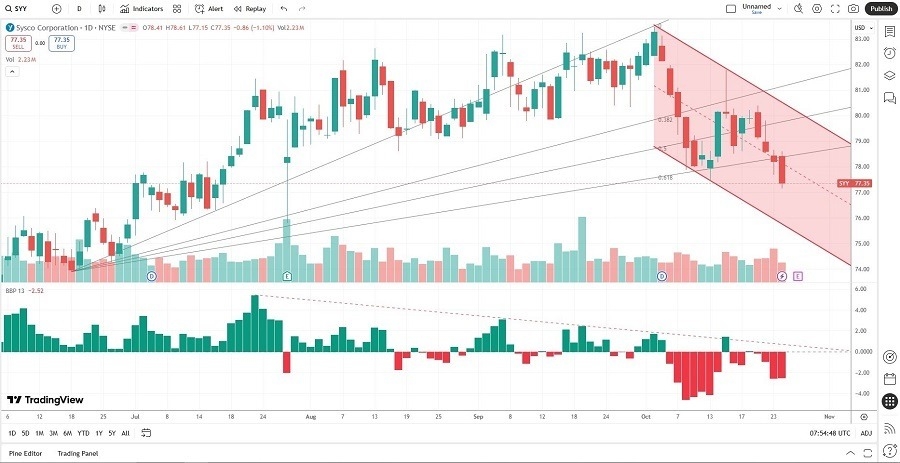
Short Trade Idea
Enter your short position between $77.15 (Friday’s intra-day low) and $78.61 (Friday’s intra-day high).
Market Index Analysis
- Sysco Corporation (SYY) is a member of the S&P 500 Index.
- This index is pushing higher on lower trading volumes, as the AI bubble expands.
- The Bull Bear Power Indicator of the S&P 500 Index shows a negative divergence and does not confirm the uptrend.
Market Sentiment Analysis
Equity futures suggest a bullish open after another record run last week, fueled by weaker than expected yet still high inflation data that confirmed hopes for another 25-basis-point interest rate cut this week. After disappointing earnings from Netflix, Tesla, and IBM, markets hope that earnings from Alphabet, Microsoft, Meta, Amazon, and Apple will keep the rally intact, even as fears of an AI bubble rise. Expectations for a better-than-expected outcome of the Trump-Xi meeting in South Korea add to bullish sentiment this morning.
Sysco Corporation Fundamental Analysis
Sysco Corporation is the world’s largest food distributor. It has over 700,000 customers and operates 340 distribution centers in ten countries.
So, why am I bearish on SYY ahead of its earnings?
Input costs have risen, and I expect this week’s earnings release to extend the ongoing slowdown in revenue growth. SYY has decreased its dividend over the past three years, a sign of financial stress in its balance sheet. Gross margins remain weak, and the pace of recovery could be slower than what investors expect. Conservative guidance could magnify the current sell-off if SYY misses on core metrics. The price-to-book ratio suggests the company remains highly overvalued.

Sysco Corporation Fundamental Analysis Snapshot
The price-to-earnings (P/E) ratio of 20.74 makes SYY an inexpensive stock. By comparison, the P/E ratio for the S&P 500 is 30.52.
The average analyst price target for SYY is $86.81, suggesting limited upside potential with rising downside risks.
Sysco Corporation Technical Analysis
Today’s SYY Signal

Sysco Corporation Price Chart
- The SYY D1 chart shows price action inside a bearish price channel.
- It also shows price action breaking down below its ascending Fibonacci Retracement Fan.
- The Bull Bear Power Indicator is bearish with a descending trendline.
- The average bearish trading volumes are higher than the average bullish trading volumes.
- SYY corrected as the S&P 500 index recorded fresh all-time highs, a bearish confirmation.
My Call on Sysco Corporation
I am taking a short position in SYY between $77.15 and $78.61. SYY has underwhelmed, and its defensive capabilities have failed to deliver. Sysco Corporation has cut its dividend, suffers from weak gross margins, and has conservative guidance, setting it up for a post-earnings disappointment.
- SYY Entry Level: Between $77.15 and $78.61
- SYY Take Profit: Between $63.76 and $67.12
- SYY Stop Loss: Between $83.47 and $86.81
- Risk/Reward Ratio: 2.12
Ready to trade our daily stock signals? Here is our list of the best stock brokers worth reviewing.
