
A slowdown in revenue growth rates, a meager dividend, and a crumbling labor market have powered the 33%+ correction. Will the sell-off continue?
Short Trade Idea
Enter your short position between 198.97 (yesterday’s intra-day low) and 208.50 (yesterday’s intra-day high).
Market Index Analysis
- Paycom Software (PAYC) is a member of the S&P 500.
- This index grinds to fresh records with bearish headwinds increasing.
- The Bull Bear Power Indicator of the S&P 500 shows a negative divergence, and does not support the uptrend.
Market Sentiment Analysis
Equity markets shook off the US government shutdown and pushed to fresh all-time highs, as investors bet that the shutdown would be short-lived. The extension of the equity rally, fueled by an apparent AI bubble, has reached dangerous levels, exceeding the pre-Dot-Com bubble. The labor market continues to weaken rapidly, as measured by the ADP report, which showed a loss of 32,000 jobs in September, and a downward revision for August from 54,000 job gains to 3,000 job losses.
Paycom Software Fundamental Analysis
Paycom Software is an online payroll and human resources software company. It caters to customers in 190 countries in 15 dialects. Its core software products include Beti, Global HCM, GONE, and IWant. The latest addition is a command-driven AI engine for employee data searches, but it is more hype than a breakthrough in HR management.
So, why am I bearish on PAYC after its 33%+ sell-off?
The command-driven AI engine is underwhelming, and Paycom Software is missing meaningful AI innovation despite replacing 500 employees with AI at its headquarters. Revenue growth is slowing, and billings data lacks industry peers. The meager dividend does not compensate investors for navigating challenging business conditions amid a labor market contraction.
Paycom Software Fundamental Analysis Snapshot
Metric | Value | Verdict |
P/E Ratio | 29.34 | Bearish |
P/B Ratio | 6.79 | Bearish |
PEG Ratio | 1.92 | Bullish |
Current Ratio | 1.30 | Bearish |
ROIC-WACC Ratio | Positive | Bullish |
The price-to-earnings (P/E) ratio of 29.34 makes PAYC an expensive stock. By comparison, the P/E ratio for the S&P 500 is 29.85.
The average analyst price target for PAYC is 249.25. It suggests excellent upside potential, but I believe downgrades are in order due to its underperformance.
Paycom Software Technical Analysis
Today’s PAYC Signal
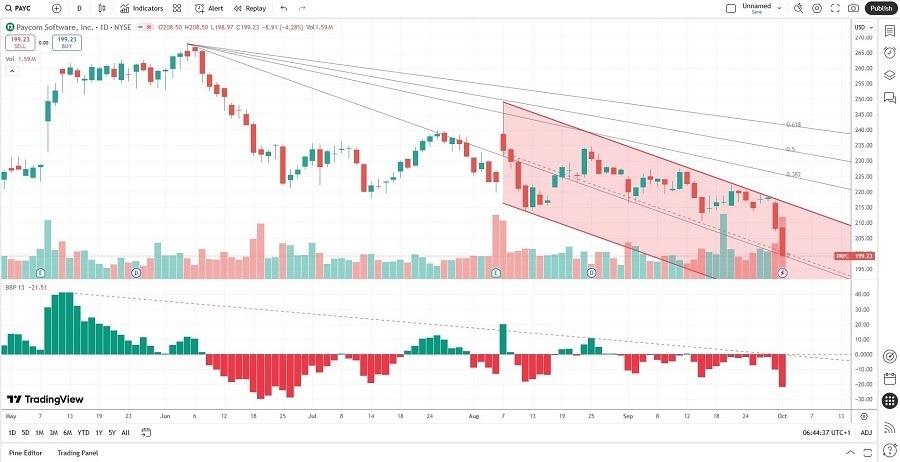
- The PAYC D1 chart shows price action inside a bearish price channel.
- It also shows price action challenging the descending 0.0% Fibonacci Retracement Fan level with a potential breakdown following.
- The Bull Bear Power Indicator is bearish with a descending trendline.
- Over the past seven trading sessions, the average trading volumes have been higher during bearish days than during bullish days.
- PAYC corrected as the S&P 500 recorded all-time highs, a significant bearish trading signal.
My Call
I am taking a short position in PAYC between 198.97 and 208.50. Despite an AI boom and bubble, Paycom Software moved in the opposite direction. The labor market contraction, weak billings, and slowing revenue growth rate are likely to continue punishing its share price.
- PAYC Entry Level: Between 198.97 and 208.50
- PAYC Take Profit: Between 169.36 and 174.90
- PAYC Stop Loss: Between 213.55 and 219.19
- Risk/Reward Ratio: 2.03