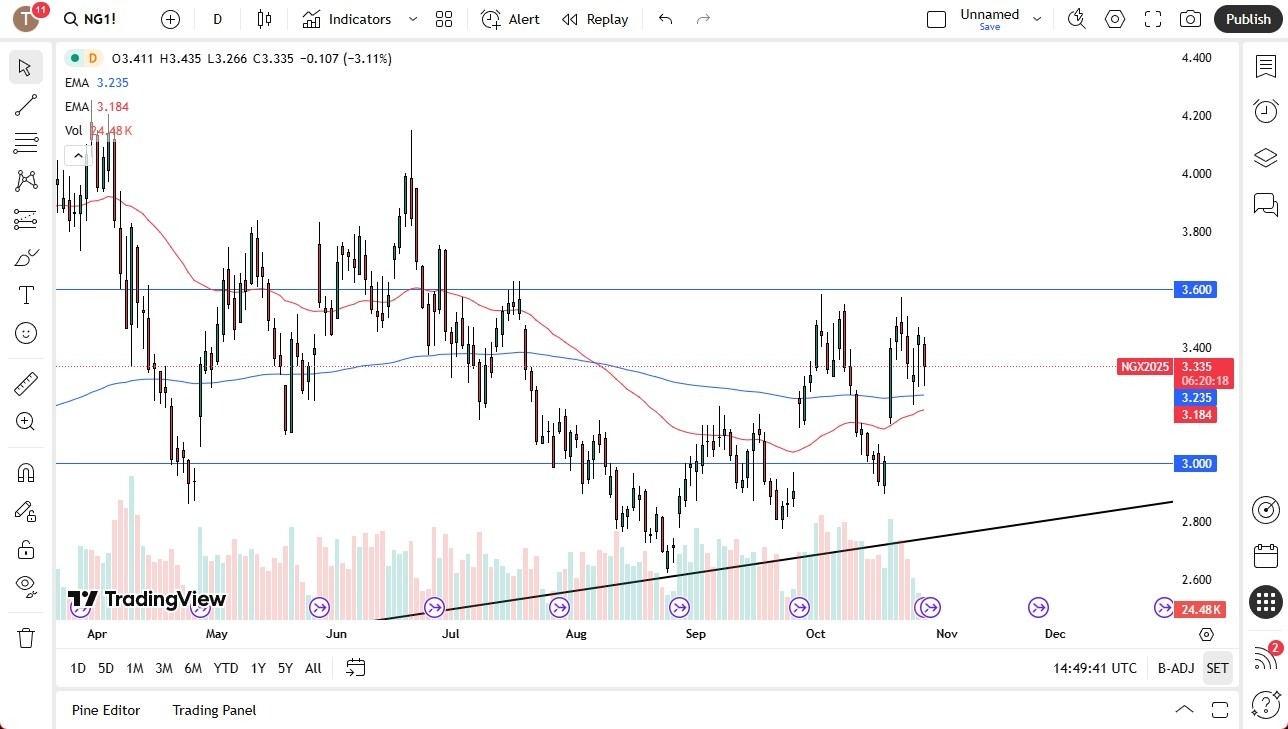
- Natural gas prices fell early Tuesday toward the 200-day EMA, finding support ahead of the contract rollover from November to December.
- Short-term pullbacks appear to be buying opportunities, with key levels at $3.18, $3.60, and $4.00.
The natural gas market has fallen pretty significantly during the early hours on Tuesday to head toward the 200-day EMA. The 200-day EMA, of course, is an indicator that many traders have been watching closely as it has offered support. At this point, the 50-day EMA is starting to curl to the upside and could trigger the so-called Golden Cross.

That being said, pay close attention to how this market behaves, as the next session — Wednesday — is when we roll over from the November contract to December. December typically carries a significant amount of demand due to colder temperatures.
Top Forex Brokers
I think this is a market that’s somewhat in flux, and it’s worth noting that short-term pullbacks will continue to be buying opportunities. If we can break above the $3.60 level, then I think we can truly move to the upside, perhaps toward the $4.00 level. Breaking down below the 50-day EMA underneath the $3.18 level opens the possibility of a move to $3.00, which I believe will be a hard floor.
This Time of Year is Typically Strong
Remember, this is a very cyclically based contract, and some of the noise seen during Tuesday’s trading session could be due to traders rolling into the next contract, as natural gas switches contracts every month. Therefore, it can sometimes appear noisy for no apparent reason. Looking at the longer-term chart, we’ve clearly been in an upswing since roughly August 2024, and I do think we continue working higher now that colder temperatures are setting in across the United States and Europe. The deeper we get into winter, the stronger the demand for natural gas will become.
Ready to trade daily Forex forecast? Here’s a list of some of the best commodities brokers to check out.
