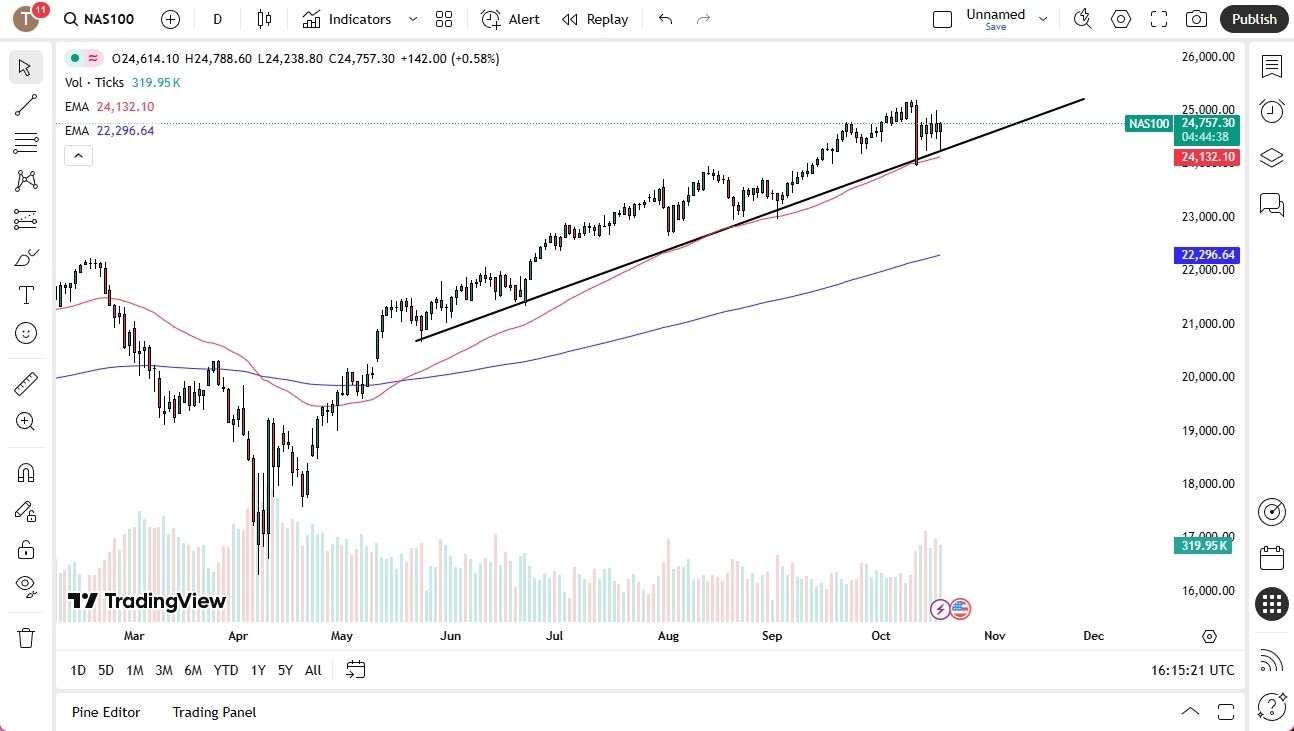
Potential signal:
- I’m a buyer of the NASDAQ 100 if we get above the 25,000 level, with a stop loss at 24,700, and a target of 26,000.

The NASDAQ 100 fell a bit during the trading session on Friday to test a major uptrend line, only to turn around and find buyers again. Furthermore, we also have the 50 Day EMA offering support, and therefore, this holds up the thought process of this being a bullish market. All things being equal, the market is likely to continue to see a lot of volatility, but quite frankly, we are still overly bullish, and I think this is still a situation where short-term pullbacks continue to get bought into.
Top Regulated Brokers
Technical Analysis
The technical analysis for the NASDAQ 100 is still positive, and the fact that we are trying to form a significant hammer suggests that there are plenty of buyers in this area. Furthermore, as previously mentioned, the 50 Day EMA is an area that has offered support right along with an uptrend line. However, we also have to pay close attention to the 25,000 level, as had been the previous resistance. With that being the case, if we can break above there, then the market is likely to go much higher. In that environment, we probably have a lot of “FOMO trading” just waiting to happen, as traders try to push the NASDAQ 100 to much higher levels.
If we turn around a breakdown below the bottom of the 50 Day EMA, then it could open up quite a bit of negativity and send this market back down to lower levels, such as the 23,000 level. However, I don’t see that happening easily, and quite frankly, this is a market that I think remains more bullish than bearish, and now we are just simply killing some time trying to figure out whether or not we can get beyond the psychologically important 25,000 level. Eventually, I think we will, and once we do, we could really start to take off to the upside.
Ready to trade our stock market forecast and analysis? Here are the best CFD stocks brokers to choose from.
