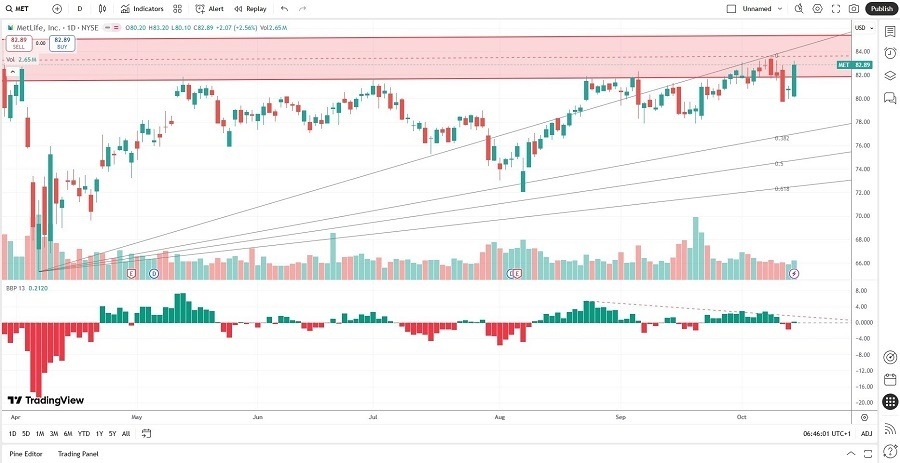
Short Trade Idea
Enter your short position between $80.10 (yesterday’s intra-day low) and $83.08 (the upper band of its horizontal resistance zone).
Market Index Analysis
- MetLife (MET) is a member of the S&P 100 and the S&P 500 indices.
- Both indices attempt to keep the bull market alive, while bearish signals are strengthening.
- The Bull Bear Power Indicator of the S&P 500 is bearish with a descending trendline.
Market Sentiment Analysis
Equity markets swung widely yesterday, as they viewed Powell’s comments about a weakening labor market as signs of more interest rate cuts. He also stated that inflationary upward pressures are primarily due to tariffs rather than broad-based inflation. Another sign of tariff impacts is average transaction prices for new cars, which exceeded $50,000 for the first time. Citigroup also warned of frothy, overvalued markets as the AI bubble expands. Uncertainty over the US-China tariff spat should keep volatility elevated.
MetLife Fundamental Analysis
MetLife is one of the largest global providers of insurance, annuities, and employee benefits. It serves over 90 million customers in over 60 countries. MET is one of the largest US companies by revenue.
So, why am I bearish on MET following its double-digit rally?
While MetLife is undergoing a digital transformation to lower acquisition and operating costs, its debt-to-asset ratio is worsening. MET has a dismal return on assets and weak profit margins. MetLife has cut its dividend over the past three years, another sign of underlying weakness. MET struggles in Asia, a significant growth market, and ongoing changes in Medicare and Medicaid add uncertainty.
MetLife Fundamental Analysis Snapshot
The price-to-earnings (P/E) ratio of 14.07 makes MET an inexpensive stock. By comparison, the P/E ratio for the S&P 500 index is 29.91.
The average analyst price target for MET is $93.33. This suggests moderate upside potential, but downside risks are rising.
MetLife Technical Analysis
Today’s MET Signal
- The MET D1 chart shows price action inside its horizontal resistance zone.
- It also shows price action between its ascending 0.0% and 38.2% Fibonacci Retracement Fan levels.
- The Bull Bear Power Indicator is bearish with a negative divergence.
- The average bearish trading volumes are higher than the average bullish trading volumes over the past fifteen trading sessions.
- MET advanced with the S&P 500 index, a bullish confirmation, but breakdown indicators have multiplied.
My Call on MetLife
I am taking a short position in MET between $80.10 and $83.08. While I applaud the digital transformation at MET, the underlying fundamentals are weak and weakening. Profit margins do not support a business expansion, and debt levels are rising, with its Asia business struggling.
- MET Entry Level: Between $80.10 and $83.08
- MET Take Profit: Between $65.21 and $69.62
- MET Stop Loss: Between $86.77 and $89.05
- Risk/Reward Ratio: 2.23
Ready to trade our free stock signals? Here is our list of the best stock brokers worth checking out.


