
Short Trade Idea
Enter your short position between $282.82 (yesterday’s intra-day low) and $288.36 (yesterday’s intra-day high).
Market Index Analysis
- Labcorp (LH) is a member of the S&P 500 Index.
- This index continues to ride the AI wave higher with underlying technical breakdown signals.
- The Bull Bear Power Indicator of the S&P 500 shows a negative divergence and does not support the uptrend.
Market Sentiment Analysis
Equity futures are in the red after the US government shutdown, with both political parties blaming each other for not acting in the country’s best interest. It is the first government shutdown since 2018, but at this point, it is more a matter of political theatrics than policy. Investors may not receive the September NFP payroll report and other essential economic reports, which could distract from underlying economic weakness, stubborn core inflation, and the expanding AI bubble.
Labcorp Fundamental Analysis
Labcorp operates in over 100 countries as one of the largest clinical laboratory networks globally. Still, it derives most of its business from the US. Labcorp has over 70,000 employees, processes more than 160 million tests annually, and receives over 10% of its revenue from Medicaid.
So, why am I bearish on LH after this stock recorded a 52-week high?
Rising challenges in the US healthcare system are a development I monitor, as Labcorp derives over 10% of revenues from Medicaid. Profit margins have declined over the past few years, and LH faces a worsening debt-to-equity ratio. Employees have also raised concerns over the quality of work. While Labcorp surprised with its last earnings release, underlying metrics have worsened.
Metric | Value | Verdict |
P/E Ratio | 30.97 | Bearish |
P/B Ratio | 2.75 | Bearish |
PEG Ratio | 3.65 | Bearish |
Current Ratio | 1.50 | Bearish |
ROIC-WACC Ratio | Negative | Bearish |
The price-to-earnings (P/E) ratio of 30.97 makes LH an expensive stock. By comparison, the P/E ratio for the S&P 500 is 29.75.
The average analyst price target for LH is $293.76. While it has negligible upside potential, downside risks have ballooned.
Labcorp Technical Analysis
Today’s LH Signal
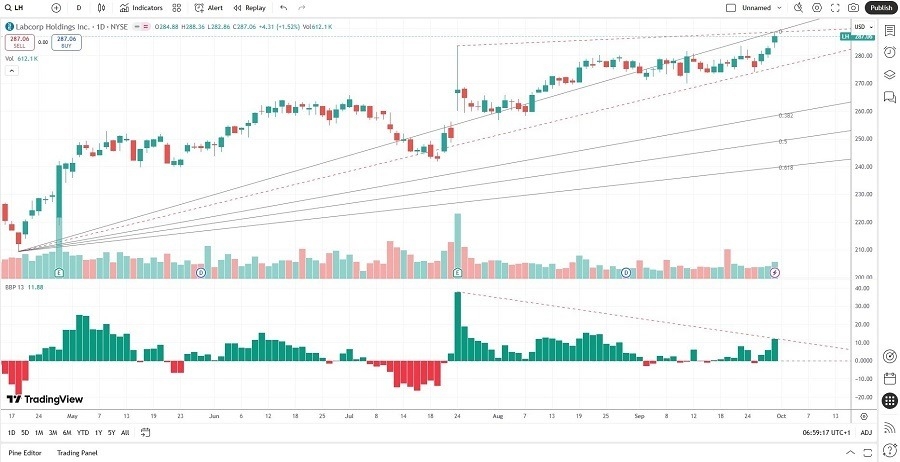
- The LH D1 chart shows price action in a rising wedge formation, a bearish chart pattern.
- It also shows price action challenging the ascending 0.0% Fibonacci Retracement Fan level.
- The Bull Bear Power Indicator is bullish but shows a negative divergence.
- The average trading volumes are higher during bearish days than during bullish days.
- LH advanced with the S&P 500 Index, a bullish confirmation, but bearish catalysts have emerged.
My Call on Labcorp
I am taking a short position in LH between $282.82 and $288.36. Valuations are high, the current share price trades near the top of analysts’ price targets, and LH continues to destroy shareholder value. LH will also struggle during a broader market sell-off.
- LH Entry Level: Between $282.82 and $288.36
- LH Take Profit: Between $241.81 and $250.51
- LH Stop Loss: Between $302.78 and $308.83
- Risk/Reward Ratio: 2.06
Ready to trade our daily stock signals? Here is our list of the best stock brokers worth reviewing.