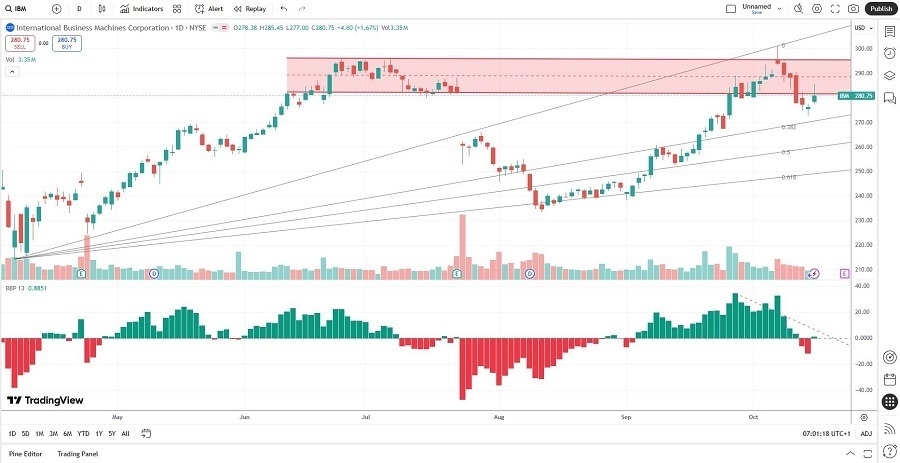
Short Trade Idea
Enter your short position between $277.00 (yesterday’s intra-day low) and $296.16 (the upper band of its horizontal resistance zone).
Market Index Analysis
- IBM (IBM) is a member of the Dow Jones Industrial Average, the S&P 100, and the S&P 500 indices.
- All three indices remain near all-time highs against a backdrop of bearish signals.
- The Bull Bear Power Indicator of the S&P 500 Index shows a negative divergence and does not support the uptrend.
Market Sentiment Analysis
Equity markets ignored the reescalation of the US-China trade war and focused on bank earnings, which, unsurprisingly, beat expectations amid the AI bubble. The Fed’s Beige Book dampened optimism and drove indices from their session highs. The government shutdown continues with no end in sight. Attempts by Treasury Secretary Scott Bessent to calm markets by stating President Trump still intends to meet President Xi later this month have had little effect, while President Trump confirmed the trade war. Stagflationary conditions persist, the AI bubble continues to expand, and volatility remains.
IBM Fundamental Analysis
IBM, nicknamed Big Blue, is a technology company present in over 175 countries. It acquired Red Hat in 2019 and has since entered that AI space by offering services including cloud computing, artificial intelligence, data and analytics, and cybersecurity.
So, why am I bearish on IBM despite its recent 15%+ rally?
While I like the growth outlook for Red Hat, IBM struggles with earnings-per-share, declining profit margins, and shareholder value destruction. The share count has increased over the past one-year and five-year period, and IBM has a massive long-term debt load. IBM requires huge investments to gain a competitive edge in AI, which could further dilute existing shareholders in the medium term.

IBM Fundamental Analysis Snapshot
The price-to-earnings (P/E) ratio of 45.28 makes IBM an expensive stock. By comparison, the P/E ratio for the S&P 500 is 30.08.
The average analyst price target for IBM is $282.98. It suggests negligible upside potential, while downside risks have risen substantially.
IBM Technical Analysis
Today’s IBM Signal

- The IBM D1 chart shows price action breaking down below its horizontal resistance zone.
- It also shows price action between its ascending 0.0% and 38.2% Fibonacci Retracement Fan levels.
- The Bull Bear Power Indicator turned bullish with a descending trendline.
- The average bearish trading volumes are higher than the average bullish trading volumes.
- IBM moved in lockstep with the S&P 500, a bullish confirmation, but bearish catalysts have increased.
Top Regulated Brokers
My Call on IBM
I am taking a short position in IBM between $277.00 and $296.16. IBM trades near the average analyst price target and struggles with negative earnings-per-share growth. Contracting profit margins and shareholder value destruction at high valuations are also red flags.
- IBM Entry Level: Between $277.00 and $296.16
- IBM Take Profit: Between $214.50 and $224.44
- IBM Stop Loss: Between $301.04 and $310.07
- Risk/Reward Ratio: 2.60
Ready to trade our daily stock signals? Here is our list of the best stock brokers worth reviewing.
