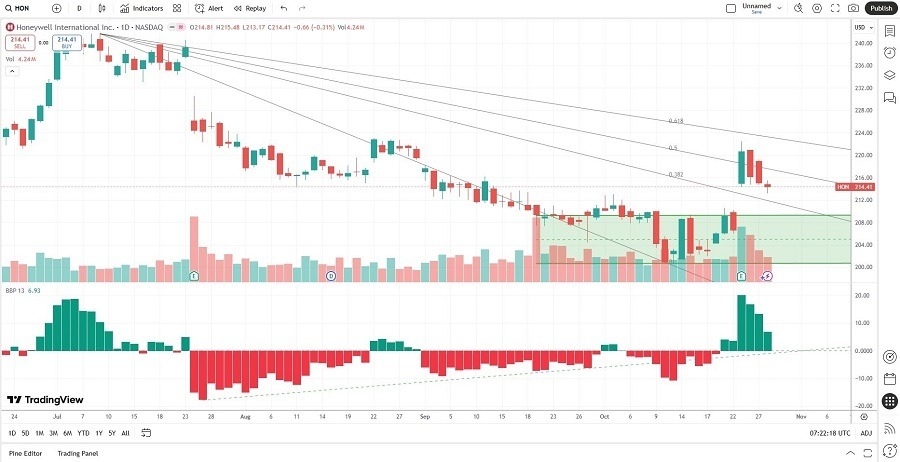
Long Trade Idea
Enter your long position between $209.41 (the upper band of its horizontal support zone) and $215.48 (yesterday’s intra-day high).
Market Index Analysis
- Honeywell International (HON) is a member of the Dow Jones Industrial Average, NASDAQ 100, the S&P 100, and the S&P 500 indices.
- All four indices recorded fresh record highs amid rising bearish indicators.
- The Bull Bear Power Indicator for the S&P 500 is in extreme bullish territory at unsustainable levels, suggesting upside exhaustion is forming.
Market Sentiment Analysis
Equity markets extended their record run, once again fueled by AI-related stocks, with NVIDIA leading the way. Investors ignore concentration risks, as the rest of the market is not doing as well. The divergence between the AI-led indices and the Russell 2000, which declined, is another red flag. While most agree that an AI bubble exists, opinions on whether and when it will burst differ. Optimism about earnings seasons, today’s anticipated interest rate cut, and a significant trade deal between the US and China have overshadowed bearish catalysts, such as a decline in consumer confidence, a weak labor market, and rising debt.
Honeywell International Fundamental Analysis
Honeywell International is a conglomerate with aerospace, building automation, industrial automation, and energy and sustainability solutions (ESS) at its core. Additionally, it operates Sandia National Laboratories and has a global workforce of over 100,000 employees.
So, why am I bullish on HON after its earnings?
HON reported earnings per share that beat consensus estimates by over 10%, rising to $2.82 from expectations of $2.56. Third-quarter revenues rose 7% to $10.4 billion, with 6% organic growth. I am encouraged by the 22% surge in orders and its increased guidance for organic growth, led by its Aerospace Technologies and Energy and Sustainability Solutions. I see more upside in its defense business and exposure to data centers.

Honeywell International Fundamental Analysis Snapshot
The price-to-earnings (P/E) ratio of 22.62 makes HON an inexpensive stock. By comparison, the P/E ratio for the S&P 500 is 30.52.
The average analyst price target for HON is $247.59. This suggests good upside potential with low downside risks.
Honeywell International Technical Analysis
Today’s HON Signal

Honeywell International Price Chart
- The HON D1 chart shows price action breaking out above its horizontal support zone.
- It also shows price action between its descending 38.2% and 50.0% Fibonacci Retracement Fan level following a double breakout.
- The Bull Bear Power Indicator is bullish with an ascending trendline.
- The bullish trading volumes rose during the breakout, while bearish trading volumes are decreasing.
- HON corrected as the S&P 500 Index recorded fresh records, a bearish confirmation, but bullish indicators have accumulated.
My Call on Honeywell International
Top Regulated Brokers
I am taking a long position in HON between $209.41 and $215.48. HON will benefit from increased defense spending and data center demand. I rank HON among the best manufacturing stocks with reasonable valuations and more upside potential.
- HON Entry Level: Between $209.41 and $215.48
- HON Take Profit: Between $253.81 and $266.50
- HON Stop Loss: Between $192.12 and $200.72
- Risk/Reward Ratio: 2.57
Ready to trade our daily stock signals? Here is our list of the best stock brokers worth reviewing.
