
A dismal return on assets, negative cash flow from operations, and a multi-year contraction in operating margins do not support the current share price. Will a breakdown in the price of Goldman Sachs stock follow?
Short Trade Idea
Enter your short position between $774.34 (yesterday’s intra-day low) and $802.50 (the mid-level of its horizontal resistance zone).
Market Index Analysis
- Goldman Sachs (GS) is a member of the Dow Jones Industrial Average, the S&P 100, and the S&P 500 indices.
- All three indices grind the AI wave higher, fueling an AI bubble, while bearish conditions accumulate.
- The Bull Bear Power Indicator of the S&P 500 shows a negative divergence and does not support the uptrend.
Market Sentiment Analysis
The AI bubble continues with NVIDIA driving markets to fresh records yesterday. Minutes from the latest FOMC meeting showed a majority supported further interest rate cuts, as they saw greater risks to employment while inflation remained stagnant. Still, several members preferred no cut. The third quarter earnings season has begun, and it should provide the next catalyst for the market. Warnings about the dangerous unraveling of a bursting AI bubble continue, consumer debt levels across all income levels are alarming, and gold continues its record rally.
Goldman Sachs Fundamental Analysis
Goldman Sachs is a multinational investment bank and financial services company. It ranks as the largest investment bank by revenue globally. The Financial Stability Board considers GS a systemically important financial institution.
So, why am I bearish on GS at current levels?
Despite being the largest investment bank by revenue globally and the equity bull market, Goldman Sachs suffers from negative cash flows from operations. The return on assets of 0.83% is insulting to investors, and operating margins have been decreasing for years. The sole bright spot is its healthy dividend, but it does not suffice to shield investors from downside risks that have increased over the past twelve months.
Metric | Value | Verdict |
P/E Ratio | 17.09 | Bullish |
P/B Ratio | 2.17 | Bullish |
PEG Ratio | 2.92 | Bearish |
Current Ratio | 0.30 | Bearish |
ROIC-WACC Ratio | Unavailable | Bearish |
Goldman Sachs Fundamental Analysis Snapshot
The price-to-earnings (P/E) ratio of 17.09 makes GS an expensive stock in its industry, but inexpensive compared to the S&P 500. By comparison, the P/E ratio for the S&P 500 is 30.17.
The average analyst price target for GS is $758.68. It suggests no upside potential, while downside risks have magnified.
Goldman Sachs Technical Analysis
Today’s GS Signal
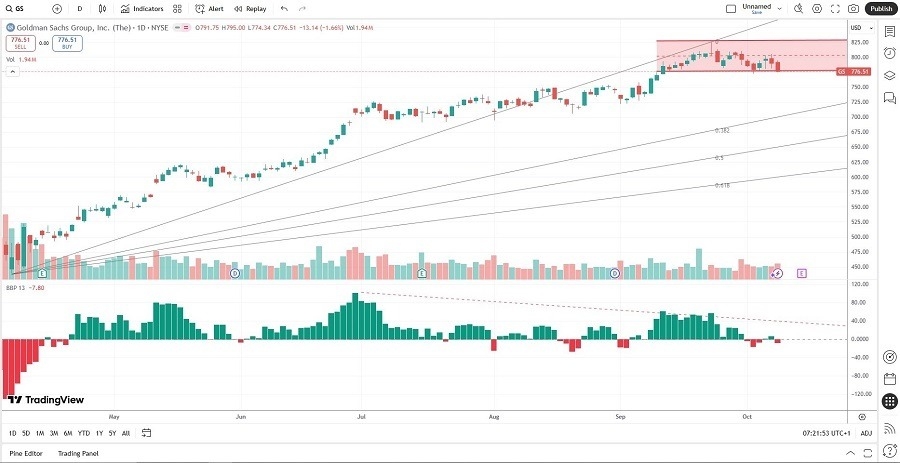
Goldman Sachs Price Chart
- The GS D1 chart shows price action challenging its horizontal resistance zone for a breakdown.
- It also shows price action between its ascending 0.0% and 38.2% Fibonacci Retracement Fan levels.
- The Bull Bear Power Indicator is bearish with a negative divergence.
- The average bearish trading volumes are higher than the average bullish trading volumes.
- GS stagnated as the S&P 500 recorded fresh all-time highs, a bearish trading signal.
My Call on Goldman Sachs
I am taking a short position in GS between $774.34 and $802.50. GS has bearish operational parameters, and some are alarmingly bearish. The pending breakdown, coupled with an earnings or outlook disappointment, could trigger a more substantial correction.
- GS Entry Level: Between $774.34 and $802.50.
- GS Take Profit: Between $672.19 and $694.05.
- GS Stop Loss: Between $825.25 and $841.76.
- Risk/Reward Ratio: 2.01
Ready to trade our free stock signals? Here is our list of the best stock brokers worth checking out.