Today’s Gold Analysis Overview:
- The overall of Gold Trend: Subject to a bearish technical correction.
- Today's Gold Support Points: $3880 – $3830 – $3740 per ounce.
- Today's Gold Resistance Points: $3985 – $4050 – $4120 per ounce.

Today's Gold Trading Signals:
- Sell gold from the resistance level of $4100 with a target of $3940 and a stop-loss at $4170.
- Buy gold from the support level of $3800 with a target of $4100 and a stop-loss at $3720.
Technical Analysis of Gold Price (XAU/USD) Today:
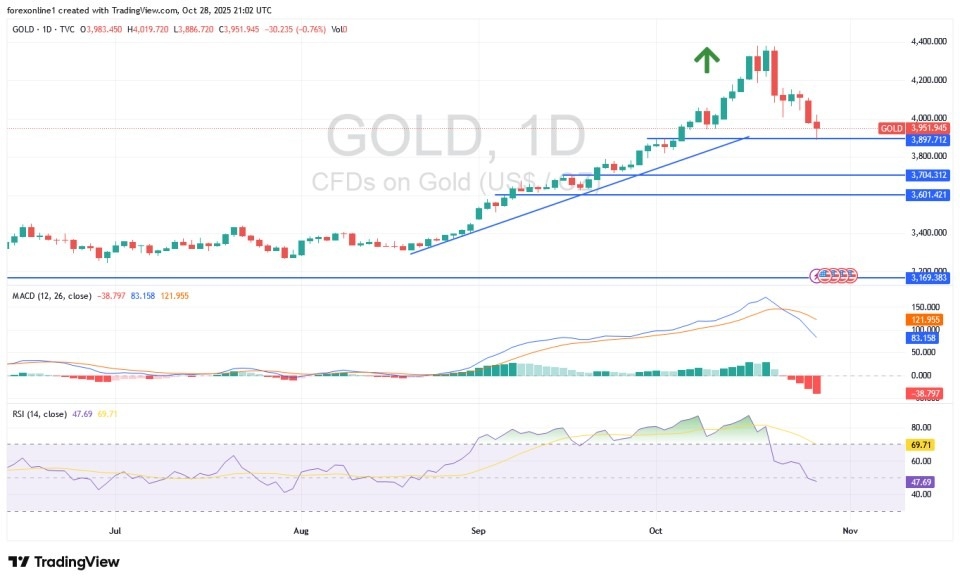
As we accurately predicted, the gold market's consecutive record gains would not last long, and at any time, the market could be subjected to strong profit-taking sales. While the pace of the selling was not like the gains, attention is now focused on important and influential events for the remainder of the week that will determine the fate of gold's immediate prices.
According to gold trading platforms, the gold index retreated from its all-time high when it tested the $4382 per ounce resistance level on the 20th of this month. With profit-taking sales, gold prices tumbled to the $3886 per ounce support level yesterday (Tuesday), the lowest price in two weeks, before settling around the $3953 per ounce level at the start of today's Wednesday session, which includes one of the important and influential events for gold trading.
Top Regulated Brokers
Gold Market and US Interest Rates
Across reliable trading company platforms, gold prices have stabilized below the $4000 per ounce level as traders now focus on the Federal Reserve's decision on U.S. interest rates, which will be announced today at 20:00 Cairo time. This will be followed by trade talks between the U.S. and China later this week. According to the view of commodity market experts, we agree that the gold market was in an overbought condition, which ultimately led to this week's correction. However, gold trading still enjoys support. For the upward wave to end, the fundamental background must change, and this has not happened yet.
Technically, and based on the daily chart performance, following the recent gold selling operations, the 14-day Relative Strength Index (RSI) has moved below the neutral line, confirming the strong control of the bears and thus the readiness for stronger bearish breakouts. At the same time, the MACD indicator is heading lower, awaiting stronger losses to confirm the bearish shift in gold's path. A strong gold rally scenario requires a return to the vicinity of the $4120 per ounce resistance, while a successful break of the $3880 support will push gold prices to stronger buying levels.
The gold market is currently experiencing a seven-day correction, ending one of the longest bulls runs in history. Meanwhile, gold bullion prices rose by more than 30% in the four months leading up to last week's record high. Furthermore, data from Bank of America's "Flow Show" report indicates that inflows into gold portfolios during this period exceeded the total inflows recorded over the previous 14 years.
Trading Advice:
We still recommend following the strategy of buying gold on every significant price dip, but without taking any risks, regardless of how strong the trading opportunities may seem.
Central Bank Gold Purchases: A Positive Factor
In this regard, the BlackRock Investment Institute believes that global central bank purchases of gold bullion will remain a "persistent factor" in boosting gold prices and sees gold bullion as a "tactical exposure in investment portfolios." Central bank purchases have been significant, with China alone adding 39.2 tones to its total holdings since returning to the market in November of last year. This can help provide a floor for overall prices, as central banks are generally reluctant to sell their holdings, and many countries that encourage gold imports, such as China and India, make it difficult for investors to transfer their investments abroad.
Meanwhile, gold-backed Exchange Traded Funds (ETFs) are attracting billions of dollars in new investments, with total additions likely to exceed 100 tones during the three months ending in September. This is more than three times the quarterly average over the past eight years.
However, Capital Economics lowered its target for gold prices by the end of 2026 to around $3,500 per ounce.
Ready to trade our Gold forecast? We’ve shortlisted the most trusted Gold brokers in the industry for you.
