
Negative earnings-per-share growth exceeding 50%, steep infrastructure costs, and a saturated market pose tremendous challenges for GoDaddy. Is more downside ahead?
Short Trade Idea
Enter your short position between $132.51 (the last time price action touched the lower band of its bearish price channel) and $137.51 (the intra-day high of its last bullish candlestick).
Market Index Analysis
- GoDaddy (GDDY) is a member of the S&P 500 index.
- This index remains near record highs, but bearish trading volumes have risen.
- The Bull Bear Power Indicator of the S&P 500 index has turned bearish with a descending trendline.
Market Sentiment Analysis
Equity markets wiped over $2 trillion off their value during Friday’s plunge, after President Trump stated that he would slap an additional 100% tariff on all existing tariffs. He walked back those comments over the weekend, suggesting the US and China will reach a deal before the November 1st deadline. The government continues its shutdown, the AI bubble rages on, and investors will receive a busy week of earnings, led by major banks. Equity futures suggest a massive rally will start the week, clawing back over 50% of Friday’s sell-off, but investors should brace for more volatility.
GoDaddy Fundamental Analysis
GoDaddy is the world’s fifth-largest web hosting company with over 20M+ customers. It focuses on micro and small companies.
So, why am I bearish on GDDY despite its 33%+ correction?
The latest AI-based addition to the GoDaddy ecosystem appears more as a desperate attempt to catch the hype and stem the sell-off than a revenue-driving development. The trailing three-year average return on invested capital is notably below the industry average, while long-term debt is excessive. I am also alarmed by the 50%+ plunge in earnings per share, and its soft estimated sales growth over the coming twelve months.
Metric | Value | Verdict |
P/E Ratio | 23.29 | Bullish |
P/B Ratio | 45.88 | Bearish |
PEG Ratio | 2.14 | Bullish |
Current Ratio | 0.64 | Bearish |
ROIC-WACC Ratio | Positive | Bullish |
GoDaddy Fundamental Analysis Snapshot
The price-to-earnings (P/E) ratio of 23.29 makes GDDY an inexpensive stock. By comparison, the P/E ratio for the S&P 500 index is 29.45.
The average analyst price target for GDDY is $189.00. It suggests excellent upside potential, but downside risks remain elevated.
GoDaddy Technical Analysis
Today’s GDDY Signal
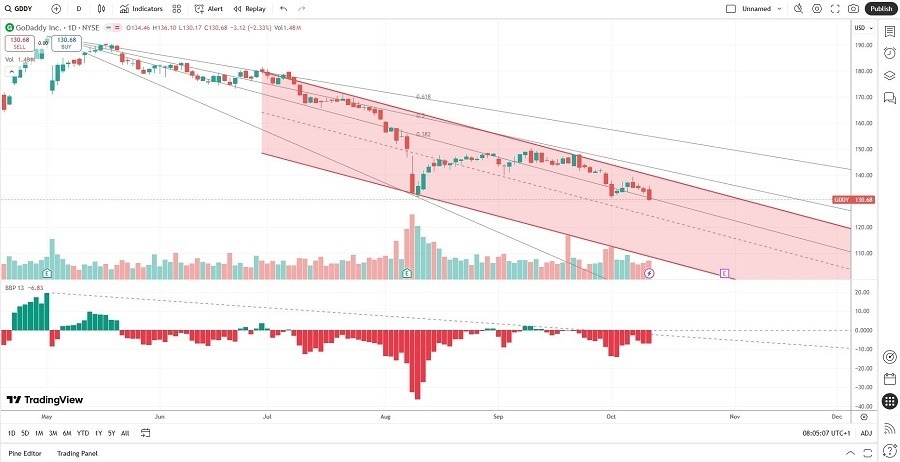
GoDaddy Price Chart
- The GDDY D1 chart shows price action inside a bearish price channel.
- It also shows price action between its descending 0.0% and 38.2% Fibonacci Retracement Fan levels.
- The Bull Bear Power Indicator is bearish with a descending trendline.
- The average bearish trading volumes are higher than the average bullish trading volumes.
- GDDY corrected as the S&P 500 advanced, a significant bearish trading signal.
My Call on GoDaddy
I am taking a short position in GDDY between $132.51 and $137.51. GDDY faces weakening fundamentals in its bookings and sales outlook. High infrastructure costs with upside price pressure, and high debt levels add to bearish catalysts.
- GDDY Entry Level: Between $132.51 and $137.51
- GDDY Take Profit: Between $99.90 and $107.62
- GDDY Stop Loss: Between $148.19 and $154.32
- Risk/Reward Ratio: 2.08
Top Regulated Brokers
Ready to trade our daily stock signals? Here is our list of the best stock brokers worth reviewing.