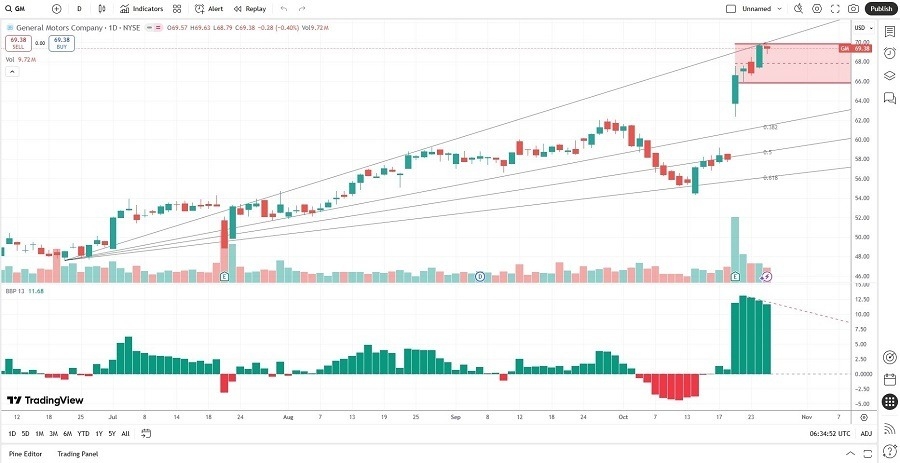
Short Trade Idea
Enter your short position between $65.89 (the lower band of its horizontal resistance zone) and $69.70 (the upper band of its horizontal resistance zone).
Market Index Analysis
- General Motors (GM) is a member of the Dow Jones Industrial Average, the S&P 100, and the S&P 500 indices.
- All three indices recorded fresh record highs, fueled by an AI bubble.
- The Bull Bear Power Indicator of the S&P 500 is bullish but indicates upward exhaustion.
Market Sentiment Analysis
Equity futures are trading in and out of positive territory. Yesterday’s session saw bulls take charge amid optimism about a broader US-China trade deal that could include agreements on rare-earth minerals, soybeans, and TikTok. The FOMC will start its two-day meeting today. While markets have priced in a 25-basis point interest rate cut, attention will shift to the outlook, where divisions among voting members could widen over future rate cuts. In the meantime, the AI bubble continues to expand globally, and underlying risks are rising.
General Motors Fundamental Analysis
General Motors is the largest auto manufacturer in the US. It manufacturers Chevrolet, Buick, GMC, and Cadillac, and owns GM Defense, which caters to the military, OnStar, ACDelco, GM Financial, and interest in Chinese brands Baojun and Wuling.
So, why am I bearish on GM despite its massive earnings beat?
GM impressed most investors with its top-and bottom-line beats. Still, its updated earnings-per-share estimate, which rose from an average of $1.94 per share to $2.02 per share, suggests that the near-15% jump in its share price after its earnings report already prices in all the positives. Profit margins are declining, debt levels are high, and the Invested Capital (ROIC) is below the Cost of Capital (WACC), destroying value.

General Motors Fundamental Analysis Snapshot
The price-to-earnings (P/E) ratio of 13.24 makes GM an inexpensive stock. By comparison, the P/E ratio for the S&P 500 is 30.52.
The average analyst price target for GM is $73.15, suggesting limited upside potential, while downside risks are increasing.
General Motors Technical Analysis
Today’s GM Signal

General Motors Price Chart
- The GM D1 chart shows price action forming a new horizontal resistance zone.
- It also shows price action between its ascending 0.0% and 38.2% Fibonacci Retracement Fan levels.
- The Bull Bear Power Indicator is bullish with a negative divergence.
- The average bullish trading volume spiked after its earnings report,but began to recede.
- GM hit fresh all-time highs with the S&P 500 Index, a bullish confirmation, but bearish catalysts began to accumulate.
My Call on General Motors
Top Regulated Brokers
I am taking a short position in GM between $65.89 and $69.70. I am unimpressed by GM’s updated earnings-per-share guidance, while investors get a meager dividend yield. Decreasing profit margins, high debt, and an overly optimistic outlook are red flags for me.
- GM Entry Level: Between $65.89 and $69.70
- GM Take Profit: Between $50.40 and $54.33
- GM Stop Loss: Between $73.15 and $75.35
- Risk/Reward Ratio: 2.13
Ready to trade our free stock signals? Here is our list of the best stock brokers worth checking out.
