
Profit margin contraction, an alarming current ratio, and shareholder value destruction have taken space in EXR. How strong is resistance?
Short Trade Idea
Enter your short position between 140.54 (yesterday’s intra-day low) and 141.96 (the lower band of its horizontal resistance zone).
Market Index Analysis
- Extra Space Storage (EXR) is a member of the S&P 500.
- This index grinds to fresh records with bearish headwinds increasing.
- The Bull Bear Power Indicator of the S&P 500 shows a negative divergence, and does not support the uptrend.
Market Sentiment Analysis
Equity markets shook off the US government shutdown and pushed to fresh all-time highs, as investors bet that the shutdown would be short-lived. The extension of the equity rally, fueled by an apparent AI bubble, has reached dangerous levels, exceeding the pre-Dot-Com bubble. The labor market continues to weaken rapidly, as measured by the ADP report, which showed a loss of 32,000 jobs in September, and a downward revision for August from 54,000 job gains to 3,000 job losses.
Extra Space Storage Fundamental Analysis
Extra Space Storage is a real estate investment trust (REIT), the largest US owner of self-storage units, and the largest self-storage property manager. It has over 4,000 locations in 43 states, and Washington, DC, with more than 2.6 million units and over 283.4 million square feet of net rentable space.
So, why am I bearish on EXR following its latest breakdown?
The current ratio is alarming and worse than almost 83% of its peers. Still, Extra Space Storage continues adding debt. Revenue growth is slowing, profit margins are contracting, and current valuations fail to reflect economic reality for EXR. Price target reductions have begun, with more likely to follow. Liabilities significantly exceed assets, and underlying business metrics are weakening.
Extra Space Storage Fundamental Analysis Snapshot
Metric | Value | Verdict |
P/E Ratio | 30.40 | Bearish |
P/B Ratio | 2.15 | Bullish |
PEG Ratio | 3.60 | Bearish |
Current Ratio | 0.30 | Bearish |
ROIC-WACC Ratio | Negative | Bearish |
The price-to-earnings (P/E) ratio of 30.40 makes EXR an expensive stock. By comparison, the P/E ratio for the S&P 500 is 29.85.
The average analyst price target for EXR is 157.10. It suggests moderate upside potential, but downside risks are rising.
Extra Space Storage Technical Analysis
Today’s EXR Signal
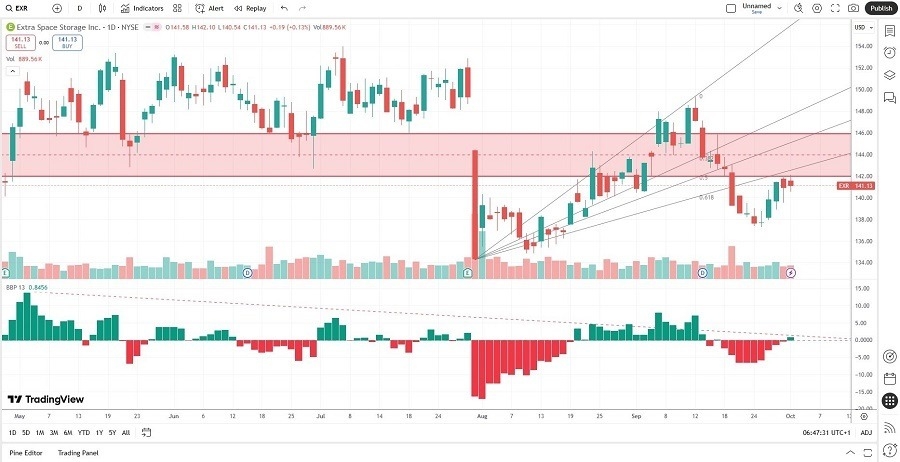
- The EXR D1 chart shows price action below its horizontal resistance zone.
- It also shows price action below its ascending 61.8% Fibonacci Retracement Fan level.
- The Bull Bear Power Indicator turned bullish with a descending trendline that could force a bearish crossover.
- The average trading volumes have been higher during bearish days than during bullish days.
- EXR corrected as the S&P 500 recorded all-time highs, a significant bearish trading signal.
My Call
I am taking a short position in EXR between 140.54 and 141.96. Economic conditions, high valuations, and an alarming current ratio flash bearish signals. Extra Space Storage continues adding debt, and this stock remains on track to extend its recent string of breakdowns.
- EXR Entry Level: Between 140.54 and 141.96
- EXR Take Profit: Between 128.55 and 134.36
- EXR Stop Loss: Between 145.94 and 149.31
- Risk/Reward Ratio: 2.22
Top Regulated Brokers